3D Visualization: Overview
Overview
On the following pages you will find a list of open source tools for the visualization of (large) scientific data distributed in spacial dimensions, as well as a brief description, feature list, commented evaluation and a how-to for a simple introduction including example data (MYFILES).
The Aim is to help you to find the visualization tool of choice for your data set and to guide you while taking the first steps towards a satisfying plot.
List of tested tools
List of (so far) untested tools
Aladin (see http://aladin.u-strasbg.fr/) - promising
blender (see http://www.blender.org/)
data explorer (see http://www.opendx.org/)
3DSlicer (see http://www.slicer.org/)
GDL (see http://gnudatalanguage.sourceforge.net/)
ImageVis3D (see http://www.sci.utah.edu/cibc/software/41-imagevis3d.html)
Mayavi (see http://code.enthought.com/projects/mayavi/docs/development/html/mayavi/)
Splotch (see http://www.mpa-garching.mpg.de/~kdolag/Splotch/)
TOPCAT (see http://www.star.bristol.ac.uk/~mbt/topcat/)
Veusz (see http://home.gna.org/veusz/) - main focus: 2D visualization
Voreen (see http://www.voreen.org/) - promising
VTK (see http://www.vtk.org/)
Evaluation
In order to provide an informative inside the evaluation of each tool is structured according to the following criteria points.
Criteria
Installability
Functionality
Usability
Adaptability
Besides the rating (zero to five points) you will be given a brief explanatory statement and a list of pros and cons that came up or have been noticed during testing.
Results
|
ParaView |
# # # # # |
|
POV-Ray |
# # # # # |
|
Vapor |
# # # # # |
|
VisIt |
# # # # # |
|
VisIVO |
# # # # # |
Acknowledgment
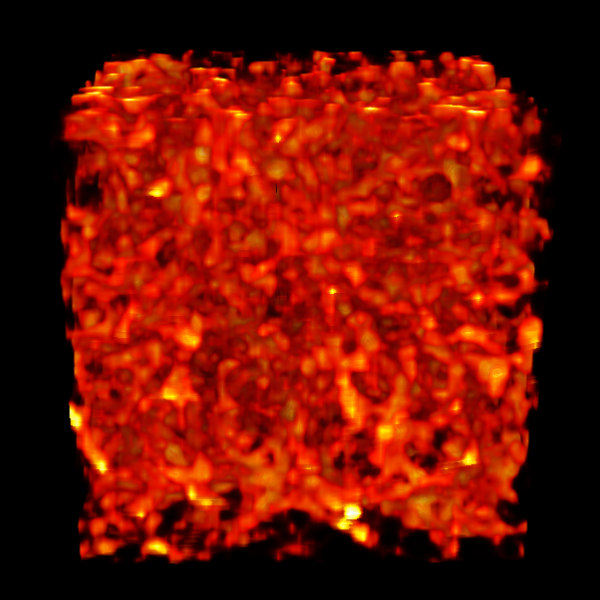
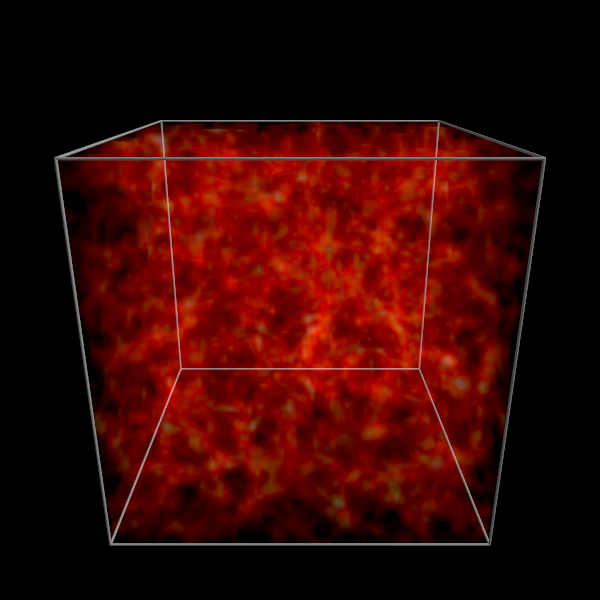
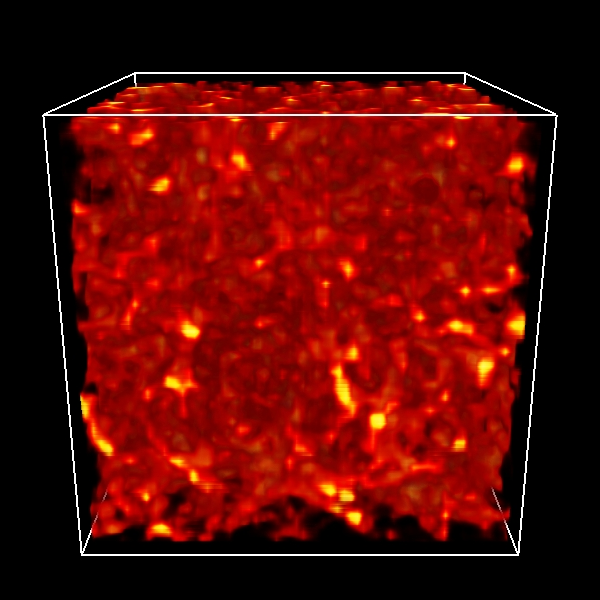
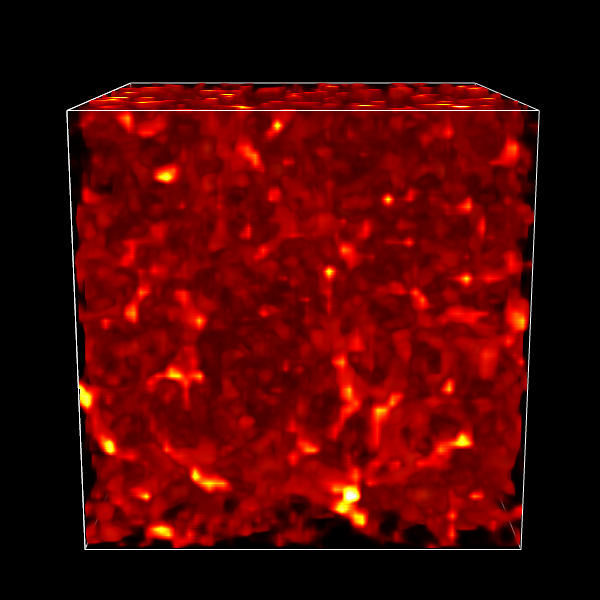
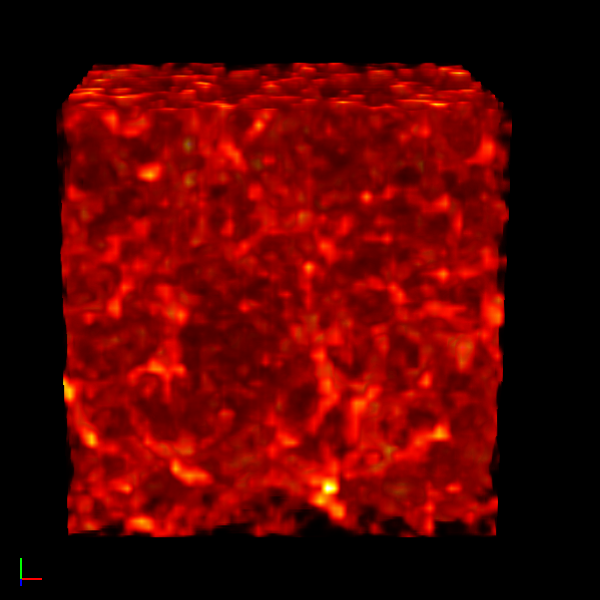
My special thanks go to Jens Jasche who supported me all the way through the project and also provided the exemplary dataset which is a density field generated by an Zel'dovich approximation for a LCDM (Lambda Cold Dark Matter) universe.
Furthermore, I would like to thank Torsten Ensslin, Gerard Lemson, Frank Matthai, Markus Rampp and Klaus Reuter for all their good advises, valuable comments and hints.
by
Marco Selig