
3D Visualization: VisIt
General information
VisIt
is a free [and open source] interactive parallel visualization and
graphical
analysis
tool for viewing scientific
data
on Unix and PC platforms. Users can quickly generate visualizations
from their data, animate them through time, manipulate them, and save
the resulting images for presentations. VisIt contains a rich set of
visualization features so that you can view your data in a variety of
ways. It can be used to visualize scalar and vector fields defined on
two- and three-dimensional (2D and 3D) structured and unstructured
meshes. VisIt was designed to handle very large data set sizes in the
terascale range and yet can also handle small data sets in the
kilobyte range.
(from
https://wci.llnl.gov/codes/visit/about.html)
Features:
Supports multiple platforms (binaries and source)
Visualization and animation of 2D and 3D scalar, vector, and tensor fields
Qualitative and quantitative data analysis
Full-featured interactive graphical user interface
Parallel and distributed processing architecture
Interfaces with C++, Python and Java
Dynamically loaded plug-ins
External links:
Internal links:
Using
database reader plug-ins for VisIt (PDF)
by
Max Knoetig
Supported file formats:
.adf, .asc, .aux, .bmp, .boundary, .bov, .boxlib2d, .boxlib3d, .bt, .case, .cdf, .cgns, .cmat, .cosmos, .cosmospp, .curve, .3d, .dat, .dbf, .ddf, .dem, .e, .ecw, .elev, .ex, .ex2, .exii, .exo, .exodus, .gen, .gxf, .h5, .hdf5, .hdr, .hierarchy, .idx, .img, .inp, .jpg, .jp2, .map, .mem, .mili, .mkf, .mpl, .mpr, .nas, .nat, .neu, .nc, .nemesis, .ntf, .obj, .okc, .p2d, .pdb, .pix, .plt, .png, .pnm, .ppm, .q, .rsw, .saf, .samrai, .sar, .sdt, .sid, .silo, .shp, .spheral, .spr, .stl, .sv, .tec, .tft, .tiff, .tp, .ultra, .ult, .vis, .vista, .vrt, .vtk, .vis, .x, .xpm
3D Visualization: Overview
Evaluation
|
Installability |
# # # # # |
|
Functionality |
# # # # # |
|
Usability |
# # # # # |
|
Adaptability |
# # # # # |
|
Overall |
# # # # # |
VisIt can easily be installed from
binary and requires no additional tools. It reads various common file
formats (see the manual for a complete list). Once you set up your
plot by choosing from the large variety of plots and operators a
first result is soon at hand, but adjusting it to your full
satisfaction may take some time. (Concrete you can choose between
contour, curve, histogram, mesh, molecule, pseudocolor, streamline,
subset, surface, tensor, truecolor, vector and volume plots and apply
boundary, isosurface, isovolume, (one, three or spherical) slice,
threshold operators to mention a few.) Another useful assortment of
gadgets for animations, scripting and data processing enables you to
visualize as well as analyze your data.
VisIt uses a single
computers graphics hardware by default but can also run on clusters
to handle large data sets. Its current version is 2.0.1 (in July
2010), but VisIt is still under active development; Linux version
1.12.2 has been tested.
Additional pros:
Comprehensive (but not overwhelming) getting started (with example files)
User-friendly window management
Offers a variety of plots and separate operators
3D rendering via splattering or ray-casting
Status (or rendering progress) comment
Images will be rendered in specified size and saved (no screenshot)
Automatic crash recovery
Supports remote hosting
Active development
Additional manual for scripting with Python
Cons:
Less intuitive interface
No interactive view
Lacks precision (e.g. opacity can only be 'drawn' via cursor)
Redraws each time the window is e.g. minimized
No possibility to abort plotting
Less settings for scales, background, etc.
How-to
In the following a simple introduction is given covering the installation procedure, the data file conversion and a guideline towards the first plots.
How-to: Install
VisIt can be downloaded at https://wci.llnl.gov/codes/visit/executables.html for Linux, Mac OS or Windows. The source code is also available for these platforms.
Hint: Members of MPA Garching are given the alternative to use the remote visualization supported by the Rechenzentrum Garching (see http://www.rzg.mpg.de/visualisation/remote-visualization for more detailed information).
To install VisIt you may proceed in the following way:
Download the compressed package and the installation script into a temporary directory (e.g. ~/visitTEMP/) which can be removed after installing and change into it.
~> cd visitTEMP/
Start the installation by running the installation script and provide it with the version (here 2.0.1), the platform and an installation directory (e.g. ~/INSTALLDIR/visit)
~/visitTEMP> visit-install 2.0.1 linux-rhel3 ~/INSTALLDIR/visit
You will then be asked for your choice of a system configuration file (choose No system configuration in case you work on a stand-alone machine) and the need of bank use while submitting jobs (choose again no in the stand-alone case).
VisIt will be installed in the specified path, changing into this directory you can now run VisIt.
~/visitTEMP>
cd INSTALLDIR/visit/bin/
~/INSTALLDIR/visit/bin> visit
Optionally you can add the VisIt directory to the user's search path with the following command.
~/INSTALLDIR/visit/bin>
cd ~
~> echo "set path = ($path ~/INSTALLDIR/visit/bin)"
>> .cshrc
How-to: Data
This How-to is as from now on assuming you have data of one scalar field on a structured grid.
You just have to create common
a VTK (Visualization Toolkit) file from your data
(MYVTKFILE.vtk).
VTK
files contain a header defining
the characteristics of the dataset followed by the single values.
For a detailed discussion about the VTK file format please check the
VTK documentation (see
http://www.vtk.org/VTK/help/documentation.html
or http://www.vtk.org/VTK/img/file-formats.pdf).
Here is a C++ code example how to do so knowing the density DATA[x][y][z] (of type float) and the dimensions NX, NY and NZ (all of type short int) of the grid. Below the header and then the dataset is written to a ASCII file (MYVTKFILE.vtk) in 'blocks' (with increasing x, then y, then z).
#include
<fstream>
// Define your scalars DATA[x][y][z] and
dimensions NX, NY and NZ here!
ofstream vtkfile;
vtkfile.open
("MYVTKFILE.vtk","w");
vtkfile << "#
vtk DataFile Version 3.0\n";
vtkfile <<
"vtkfile\n";
vtkfile << "ASCII\n";
vtkfile
<< "DATASET STRUCTURED_POINTS\n";
vtkfile <<
"DIMENSIONS " << N1 << " " <<
N2 << " " << N3 << "\n";
vtkfile
<< "ORIGIN 0 0 0\n";
vtkfile << "SPACING
1 1 1\n";
vtkfile << "POINT_DATA " <<
(N1*N2*N3) << "\n";
vtkfile << "SCALARS
scalars float 1\n";
vtkfile << "LOOKUP_TABLE
default\n";
for (int z=0; z<N3; z++)
{ for
(int y=0; y<N2; y++)
{ for (int
x=0; x<N1; x++)
{
vtkfile << D[x][y][z] << " ";
}
vtkfile
<< "\n";
}
vtkfile
<< "\n";
}
vtkfile.close();
How-to: Use
Start VisIt.
Hint: Members of MPA Garching are given the alternative to use the remote visualization supported by the Rechenzentrum Garching (see http://www.rzg.mpg.de/visualisation/remote-visualization for more detailed information).
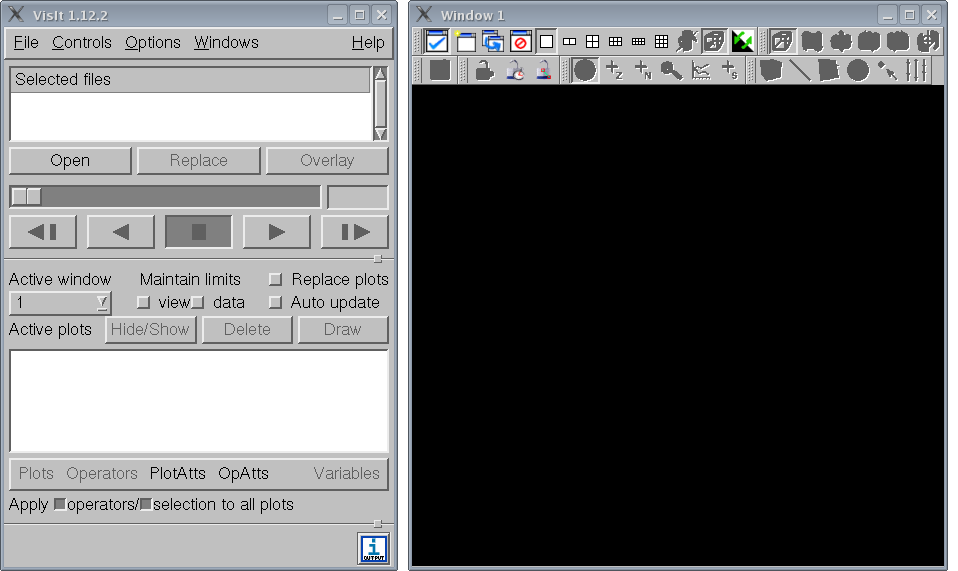
Open your dataset and set up a plot.
Add your data file to the list of selected files by clicking File > Select file ... in the menu tool bar and add it to the list, then click the Open button.
Now the Plots pull down menu is unlocked, click it and choose Volume > name of the field (here scalars).
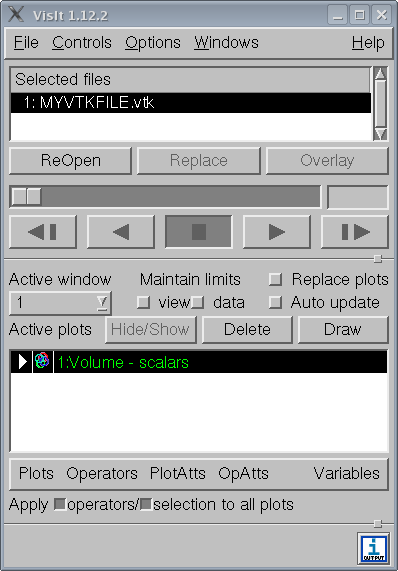
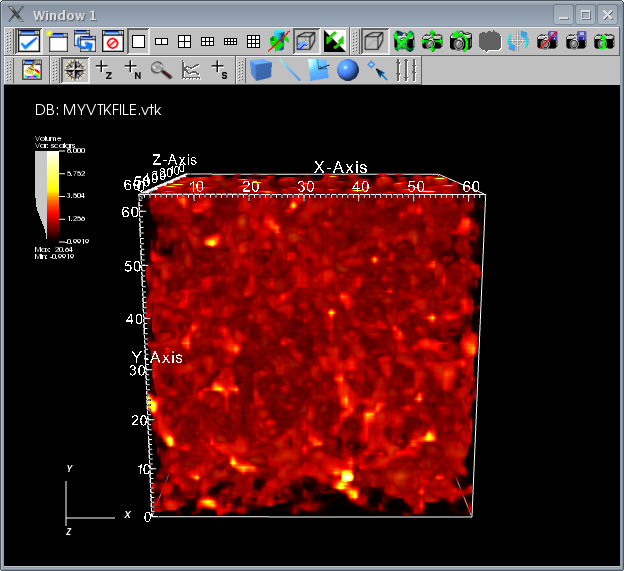
Visualize your plot by clicking Draw, it can be rotated keeping pressed the left mouse button and scaled via middle mouse button.
You can adjust the rendering modifying the plot attributes by clicking PlotAtts > Volume ... where you can set the colors, the opacity and the rendering method.
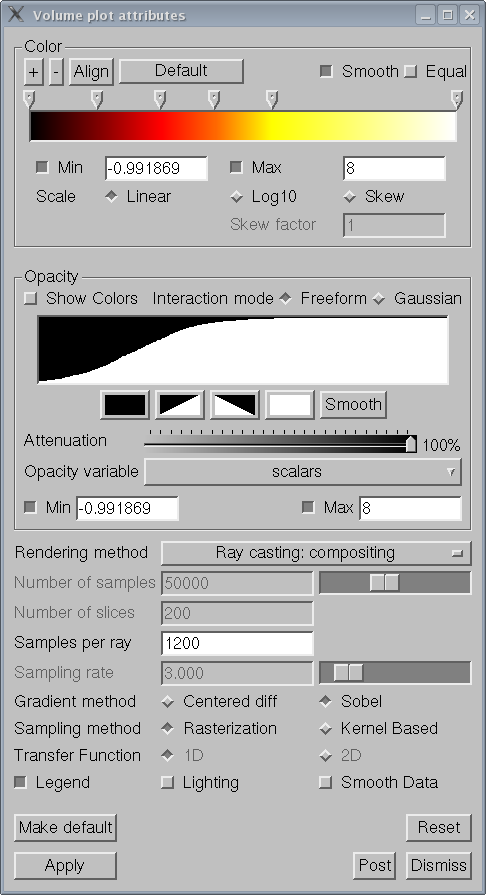
Note: General options, like e.g. antialiasing, can be defined clicking Options > Rendering ... .
In order to save the view in a window you have to set some options first, do so by clicking File > Set Save options ... and specify file name, format and resolution. Now you can save the view clicking File > Save window.
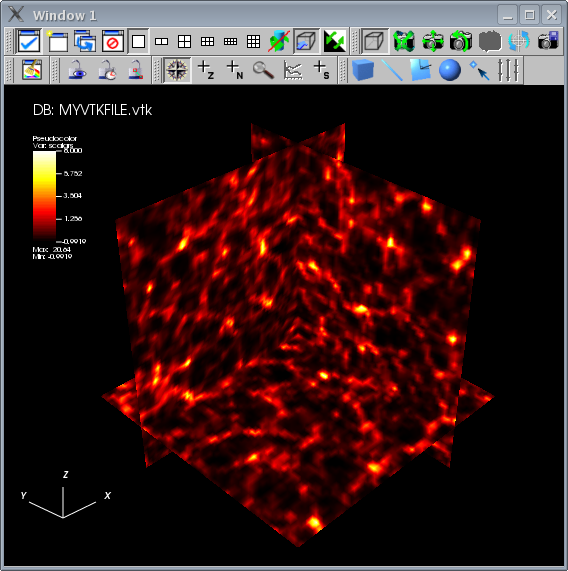
Another advantageous plot is provided by orthogonal slices through the dataset.
Disable the Volume plot by clicking the Hide/Show button
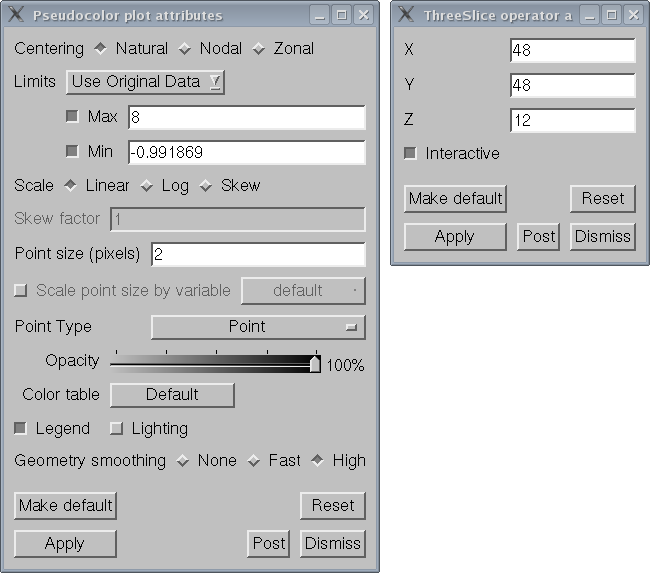
Add a new Pseudocolor plot using the Plots pull down menu and apply a ThreeSlice operator using the Operators pull down menu.
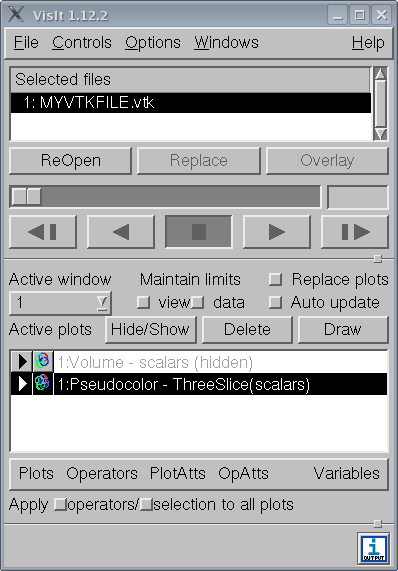
You can adjust the attributes by clicking PlotAtts > Pseudocolor ... or OpAtts > ThreeSlice ... .
Note: Color tables are defined in the menu tool bar under Controls > Color table ... .
Visualize the new plot by clicking Draw again.
Hint: Clear the window and redraw in case of incorrect plotting.
Congratulations! You can now call yourself a VisIt user.
by
Marco Selig