
3D Visualization: ParaView
General information
ParaView
is an open-source, multi-platform data analysis and visualization
application. ParaView users can quickly build visualizations to
analyze their data using qualitative and quantitative techniques. The
data exploration can be done interactively in 3D or programmatically
using ParaView's batch processing capabilities.
ParaView was
developed to analyze extremely large datasets using distributed
memory computing resources. It can be run on supercomputers to
analyze datasets of terascale as well as on laptops for smaller
data.
(from
http://www.paraview.org/)
Features:
Supports multiple platforms (binaries and source)
Visualization and animation of 2D and 3D scalar, vector, and tensor fields
Qualitative and quantitative data analysis and manipulation
Intuitive and interactive graphical user interface
Parallel and distributed rendering
Scriptable and coupleable with Python
Supports plug-ins in XML and C++
External links:
Supported file formats:
.boundary, .cas, .case, .cosmo, .cube, .csv, .dem, .d3plot, .e, .ex, .ex2v2, .exo, .exoii, .foam, .g, .gen, .gadget2, .hierarchy, .inp, .isdyna, .k, .mha, .mhd, .nc, .ncdf, .netcdf, .nhdr, .nrrd, .obj, .particles, .pdb, .pht, .ply, .png, .pop, .pvd, .pvti, .pvtk, .pvtp, .pvtr, .pvts, .pvtu, .raw, .res, .sesame, .sos, .spcth, .stl, .tec, .tiff, .tp, .vpc, .vrml, .vthb, .vti, .vtk, .vtm, .vtmb, .vtp, .vtr, .vts, .vtu, .wind, .wrl, .xdmf, .xmf, .xyz
3D Visualization: Overview
Evaluation
|
Installability |
# # # # # |
|
Functionality |
# # # # # |
|
Usability |
# # # # # |
|
Adaptability |
# # # # # |
|
Overall |
# # # # # |
ParaView can easily be installed
from binary and requires no additional tools. Various common file
formats are read by ParaView and further readers can be added (see
the tutorial for a complete list). Starting ParaView you will find a
modern, interactive interface where you can open data files, select
the desired variable (and single components) and allocate a
representation (preselected by applicability). Furthermore, filters
or animations can be applied, and you will get acceptable results
rapidly, but adjusting it to your full satisfaction may take some
time. The interactive rendering is based on performing rendering on
lower detail level while e.g. rotating the object.
ParaView is
capable of using a single computers graphics hardware up to graphic
clusters to handle large data sets. Its current version is 3.8.0 (in
July 2010), but ParaView is still under active development; Linux
version 3.8.0 has been tested.
Additional pros:
Instructive tutorial (with example files), online documentation
Modern, intuitive, interactive interface (with useful button hints)
Offers a variety of representations and filters
Easily accessible informations (e.g. range)
Supports remote hosting
(Python) scripting instructions in the tutorial
Active development
Cons:
One 3D rendering method, limited rendering options
Redraws each time the window is e.g. minimized
No possibility to abort plotting
Imaging errors occur (when screenshot size differs from windows size)
Commercial ParaViewPro support subscription and commercial guides
How-to
In the following a simple introduction is given covering the installation procedure, the data file conversion and a guideline towards the first plots.
How-to: Install
ParaView can be downloaded at http://www.paraview.org/paraview/resources/software.html for Linux, Mac OS or Windows. The source code is also available for these platforms.
Hint: Members of MPA Garching are given the alternative to use the remote visualization supported by the Rechenzentrum Garching (see http://www.rzg.mpg.de/visualisation/remote-visualization for more detailed information).
To install ParaView you may proceed in the following way:
Download the compressed binary package into a temporary directory (e.g. ~/paraviewTEMP/) which can be removed after installing and change into it.
~> cd paraviewTEMP/
Extract the package and into an installation directory (e.g. ~/INSTALLDIR/).
~/paraviewTEMP> tar -xvf ParaView-3.8.0-Linux-i686.tar.gz -C ~/INSTALLDIR/
Changing into the installation directory (adjusted to your version number) you can now run ParaView by executing the following command.
~/paraviewTEMP>
cd
~/INSTALLDIR/ParaView-3.8.0-Linux-i686/bin/
~/INSTALLDIR/ParaView-3.8.0-Linux-i686/bin>
./paraview
How-to: Data
This How-to is as from now on assuming you have data of one scalar field on a structured grid.
You just have to create a
common VTK (Visualization Toolkit) file from your data
(MYVTKFILE.vtk).
VTK
files contain a header defining
the characteristics of the dataset followed by the single values.
For a detailed discussion about the VTK file format please check the
VTK documentation (see
http://www.vtk.org/VTK/help/documentation.html
or http://www.vtk.org/VTK/img/file-formats.pdf).
Here is a C++ code example how to do so knowing the density DATA[x][y][z] (of type float) and the dimensions NX, NY and NZ (all of type short int) of the grid. Below the header and then the dataset is written to a ASCII file (MYVTKFILE.vtk) in 'blocks' (with increasing x, then y, then z).
#include
<fstream>
// Define your scalars DATA[x][y][z] and
dimensions NX, NY and NZ here!
ofstream vtkfile;
vtkfile.open
("MYVTKFILE.vtk","w");
vtkfile << "#
vtk DataFile Version 3.0\n";
vtkfile <<
"vtkfile\n";
vtkfile << "ASCII\n";
vtkfile
<< "DATASET STRUCTURED_POINTS\n";
vtkfile <<
"DIMENSIONS " << N1 << " " <<
N2 << " " << N3 << "\n";
vtkfile
<< "ORIGIN 0 0 0\n";
vtkfile << "SPACING
1 1 1\n";
vtkfile << "POINT_DATA " <<
(N1*N2*N3) << "\n";
vtkfile << "SCALARS
scalars float 1\n";
vtkfile << "LOOKUP_TABLE
default\n";
for (int z=0; z<N3; z++)
{ for
(int y=0; y<N2; y++)
{ for (int
x=0; x<N1; x++)
{
vtkfile << D[x][y][z] << " ";
}
vtkfile
<< "\n";
}
vtkfile
<< "\n";
}
vtkfile.close();
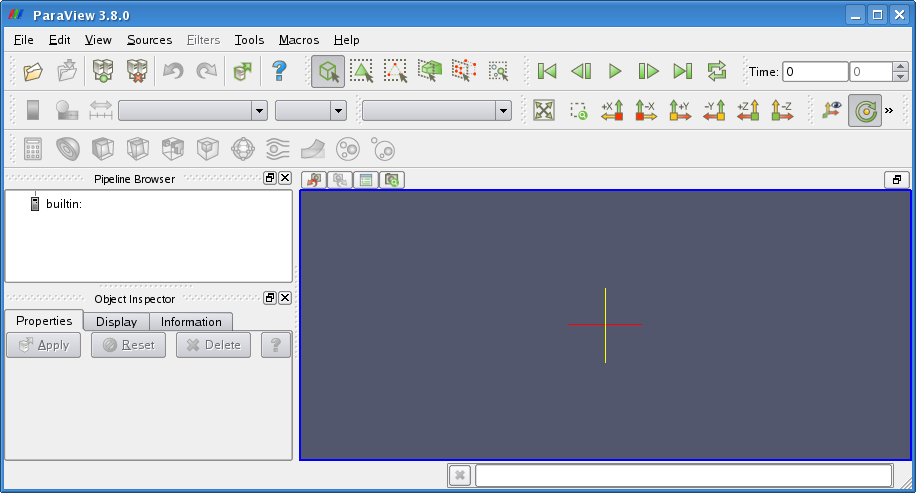
How-to: Use
Start ParaView.
Hint: Members of MPA Garching are given the alternative to use the remote visualization supported by the Rechenzentrum Garching (see http://www.rzg.mpg.de/visualisation/remote-visualization for more detailed information).
Load in your dataset and plot the chosen representation.
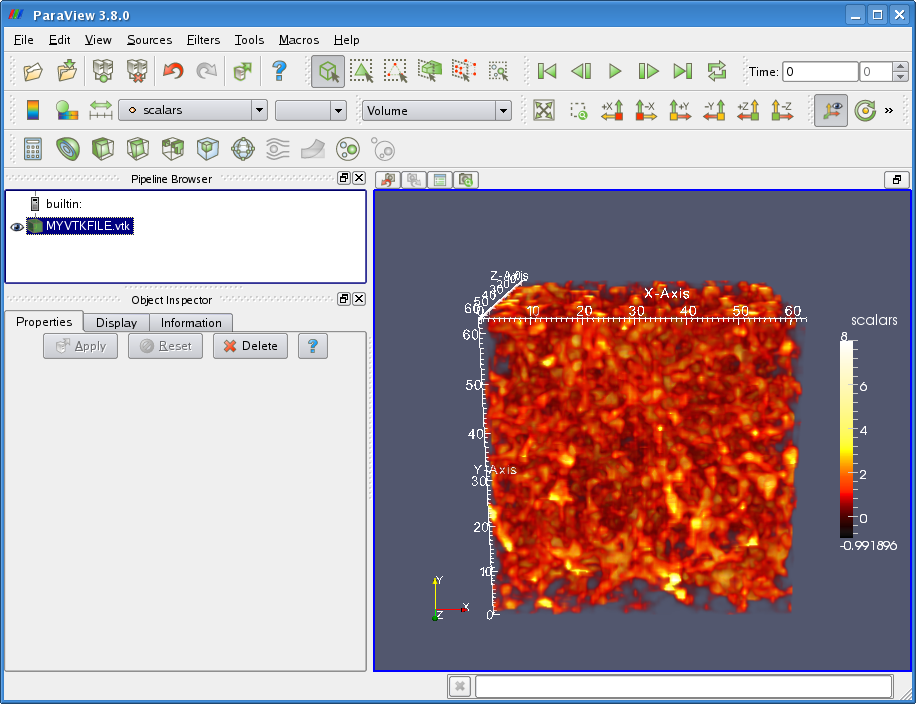
To open the VTK file click in the menu tool bar File > Open and select the file.
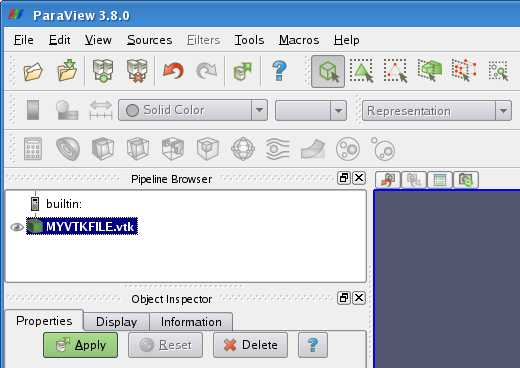
Hint: You can also use the shortcuts in the tool bar(s) for most actions.
Click Apply and then select the Volume representation. In case your dataset contains more fields select the one of interest.
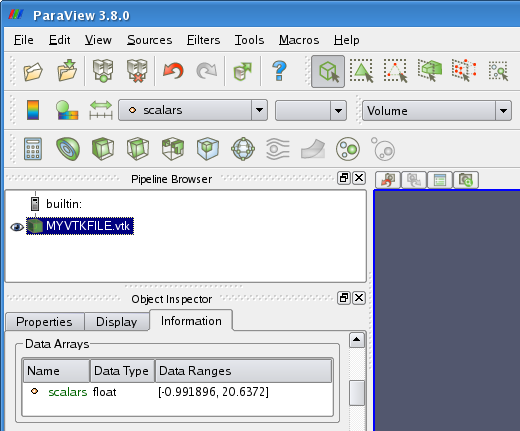
Note: To enable or disable the plot view click in the Pipeline Browser on the 'eye' in front of your dataset.
The Plot can be rotated keeping pressed the left mouse button, translated via middle and scaled via right mouse button.
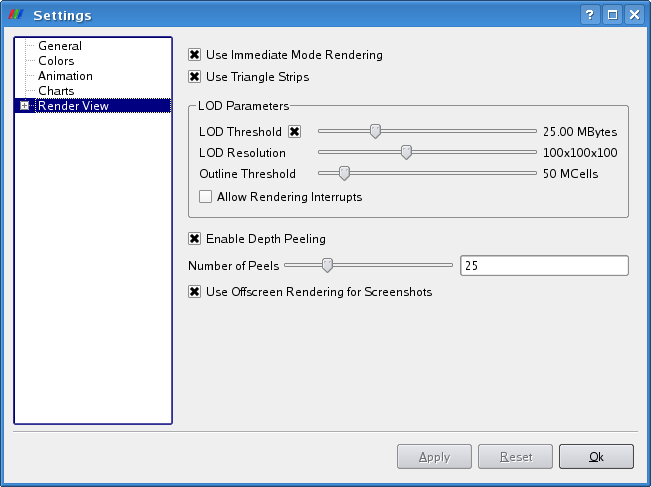
Rendering options can be adjusted clicking Edit > Settings... > Render View.
Adjustments to the rendering can be made in the Display tab of the Object Inspector, there you can modify the Color Map (CM) by simply clicking Edit Color Map... .

Hint: You may want to choose (and import) the ParaView Color Map MYCM.xml.
Additional filters can be applied to plot e.g. (plane or spheric) 'slices'.
Select your dataset in the Pipeline Browser, click in the menu tool bar Filters > Common > Slice, adjust the origin and normal values in the Properties tab of the Object Inspector and finally click Apply.
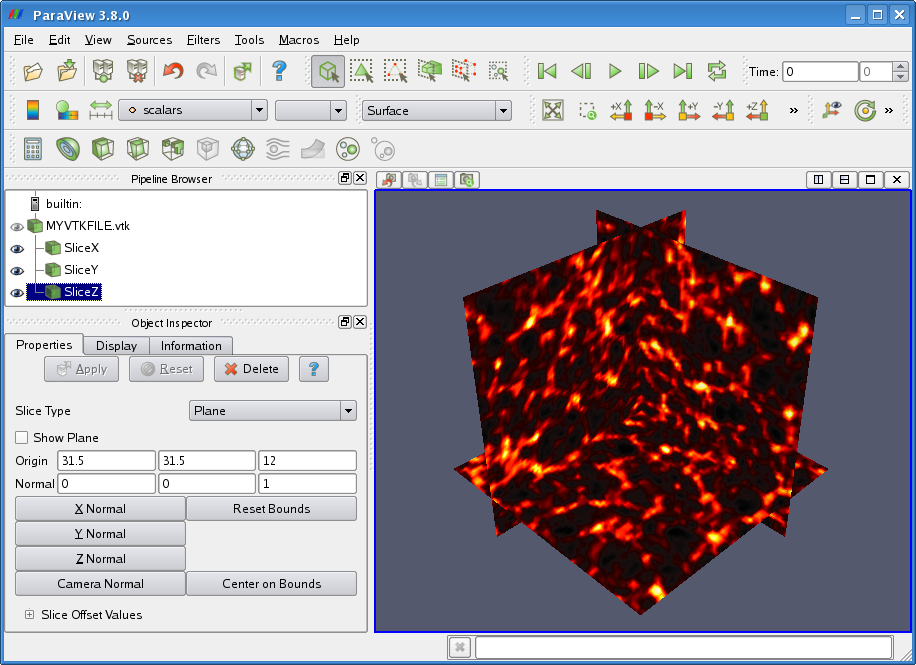
Note: The CM is automatically kept and the opacity removed.
Congratulations! You can now call yourself a ParaView user.
by
Marco Selig