Animation of a projected view of a simulated Auriga galaxy that looks particuarly like our Galaxy; there is a bar of stars running through its centre very similar to the Milky Way. Viewed from the side, the simulated galaxy has a prominent X-shape, also called a boxy-peanut bulge. The peanut is made up of stars that get kicked out of the plane of the disc, because their orbits are excited by the rotating bar (much like a child on a swing reaching higher and higher heights if pushed at the right frequency). So, when we look at all the stars in projection, the result is a shape that looks like an X, or a shelled peanut. By the way, we also know that there is a peanut at the heart of our own Milky Way - so X really does mark the spot, or in this case, the centre of our Galaxy.
Movies and Images

Projections of the gas density (left), temperature (middle) and gas metallicity (right) of the high resolution level 3 simulation of Au 6, at three different redshifts.
 <
>
<
>
Auriga 1
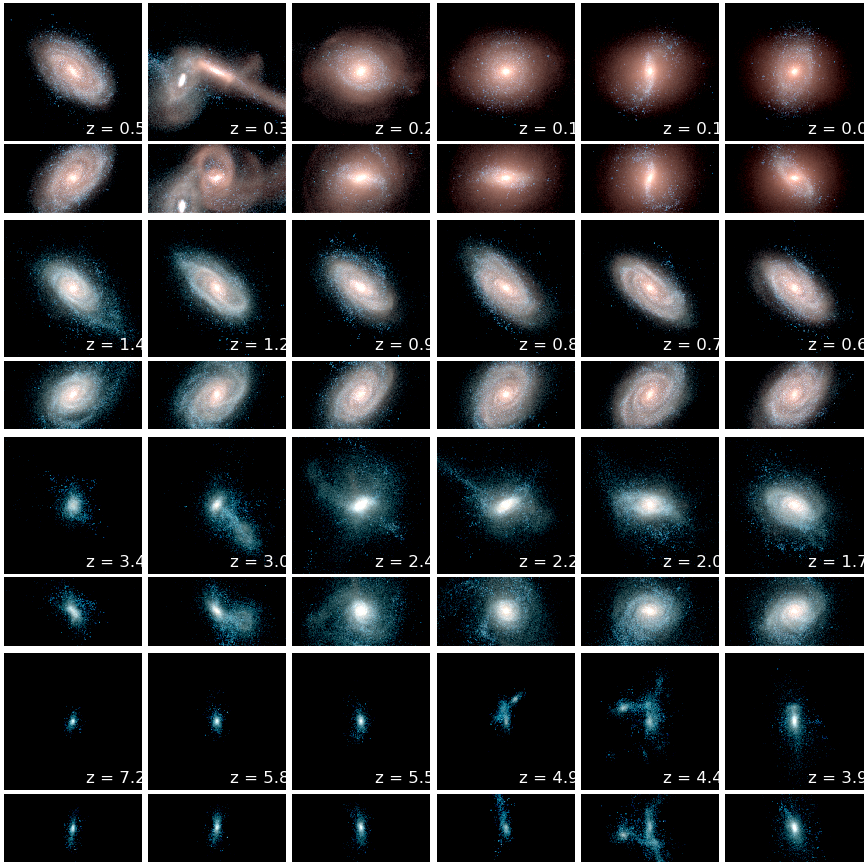
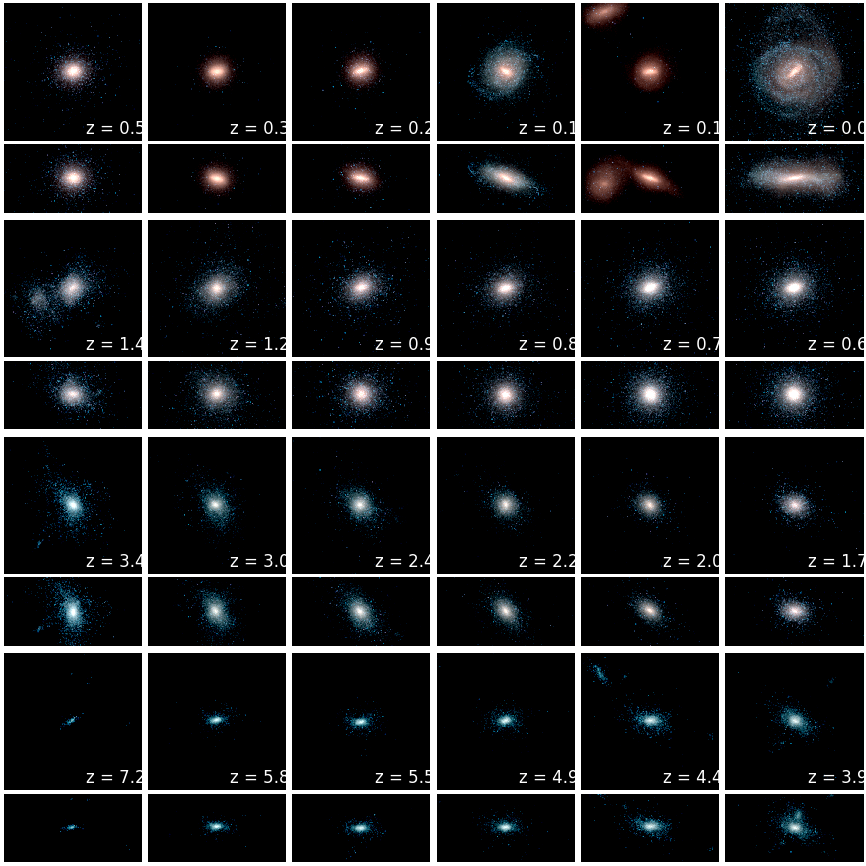
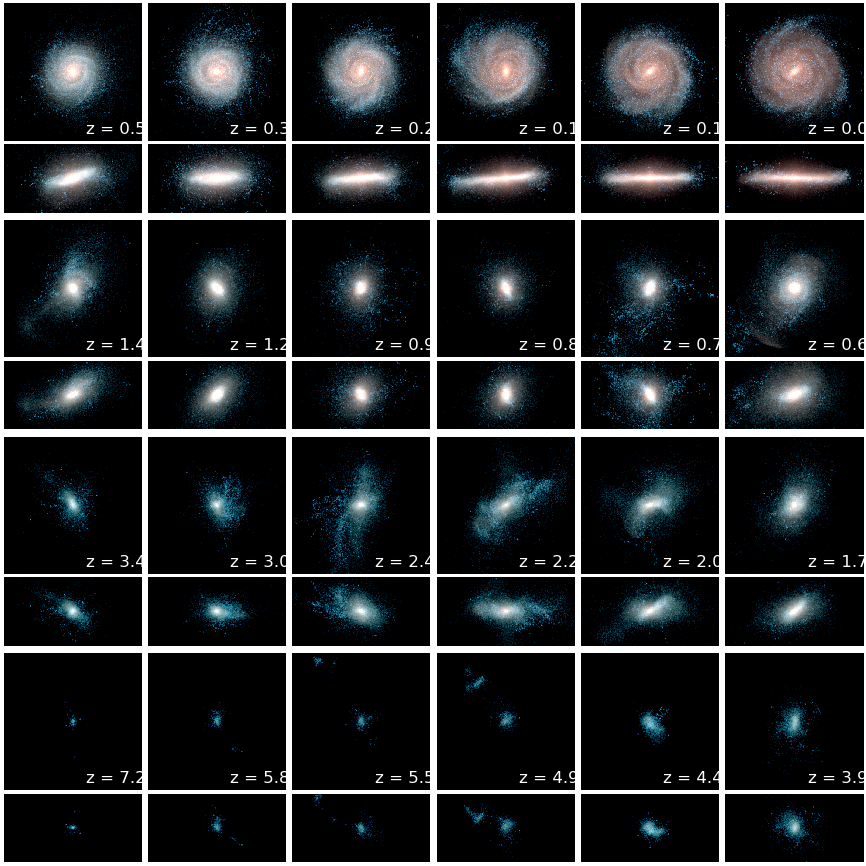
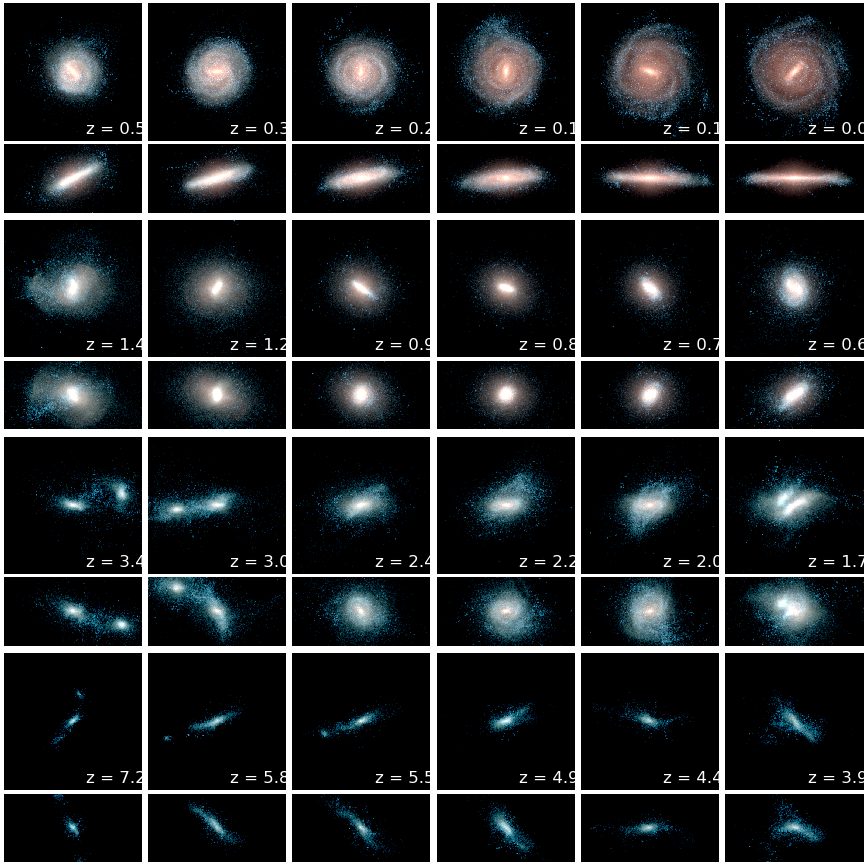
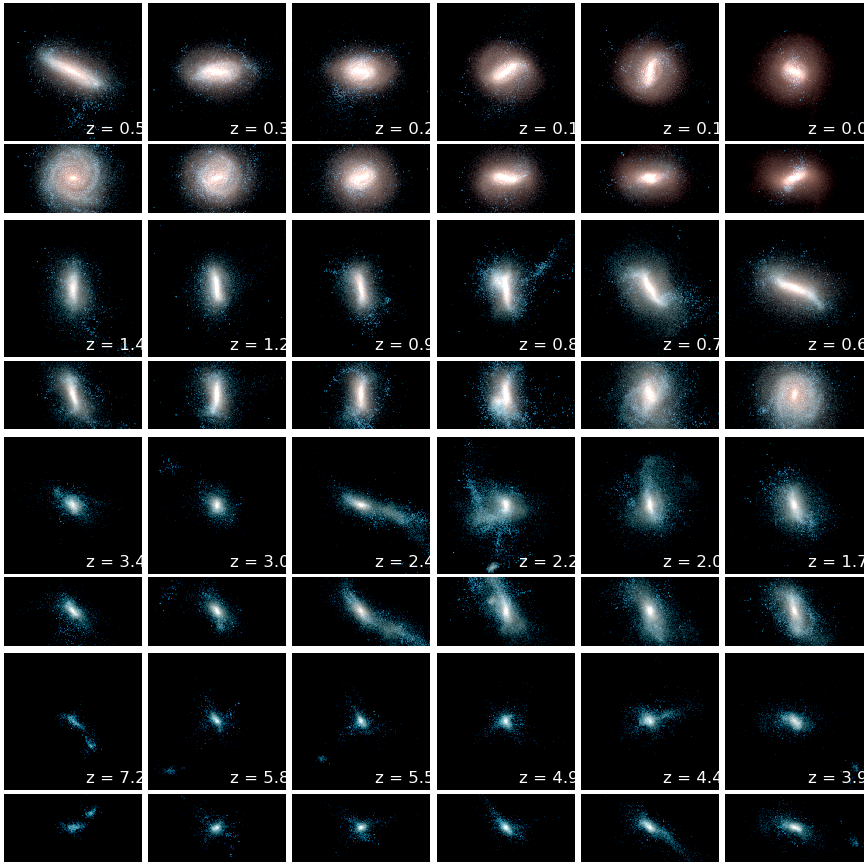
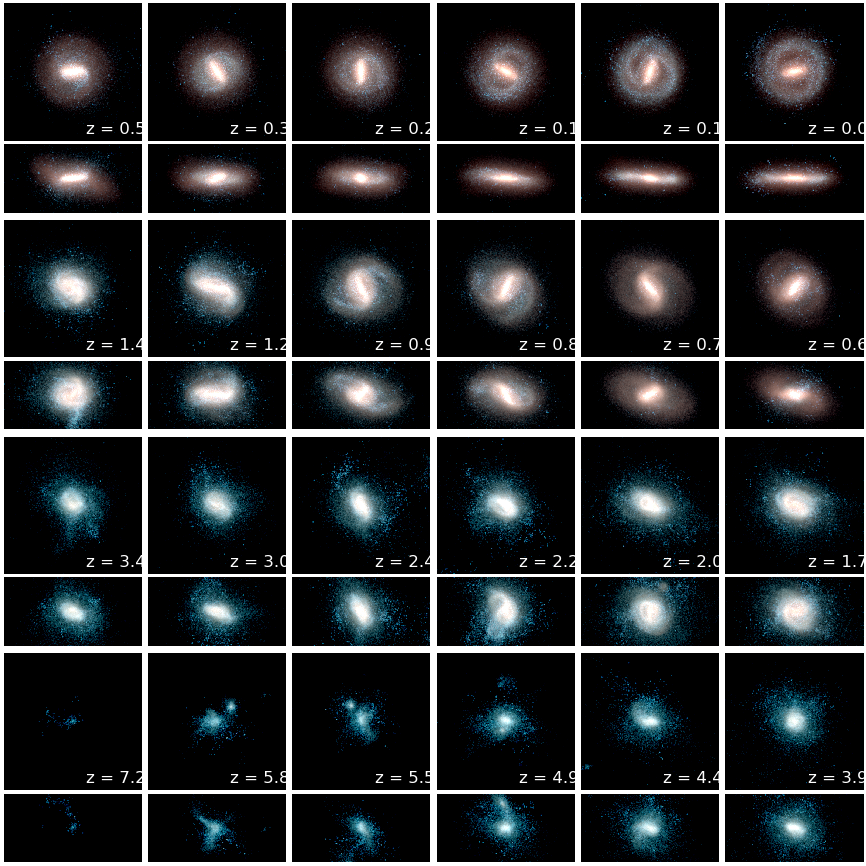
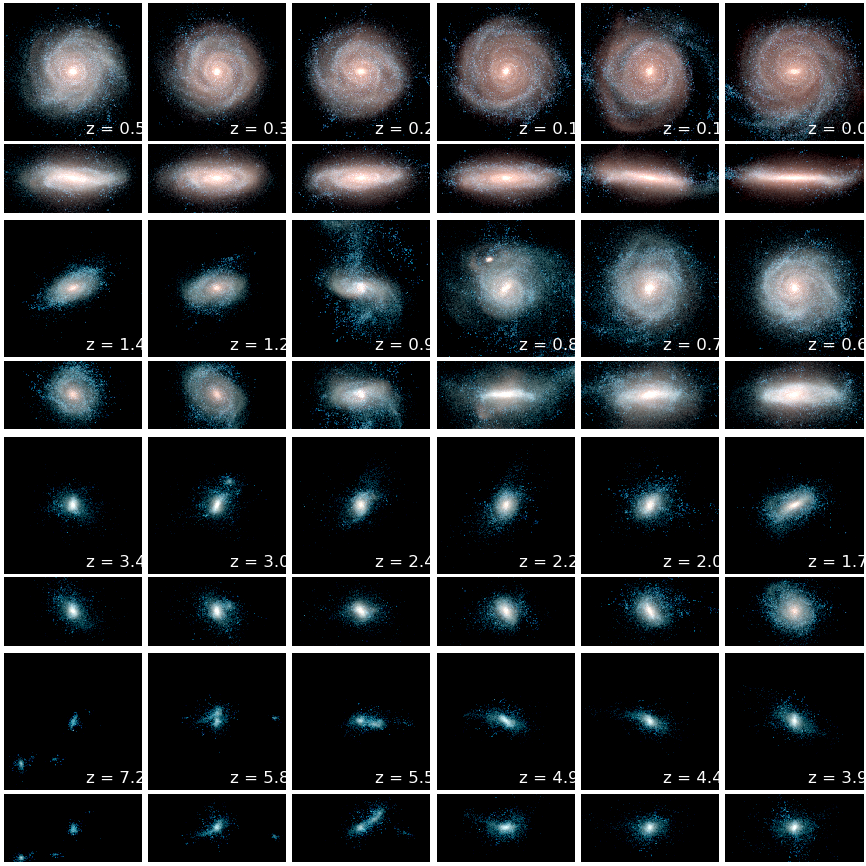
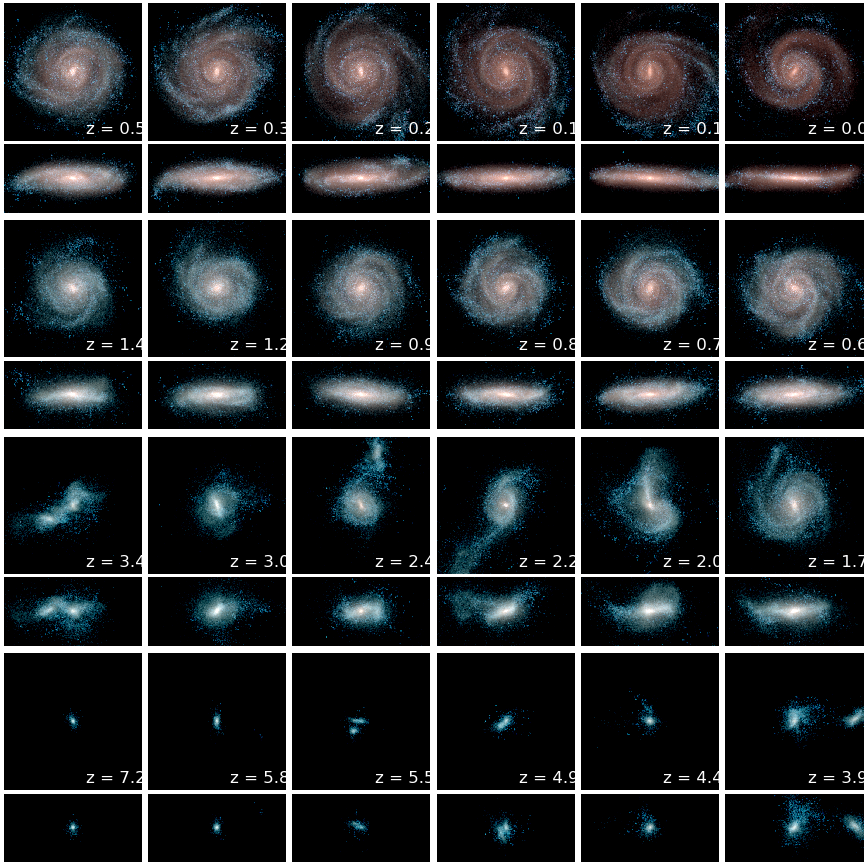
Time evolution of the stellar component of an Auriga galaxy. The 3-band image maps the K-, B- and U-band luminosities to the red, green and blue color chanels, respectively. The earliest time is the bottom-left panel, with subsequent snapshots proceeding right and then upward.
 <
>
<
>
Auriga 2
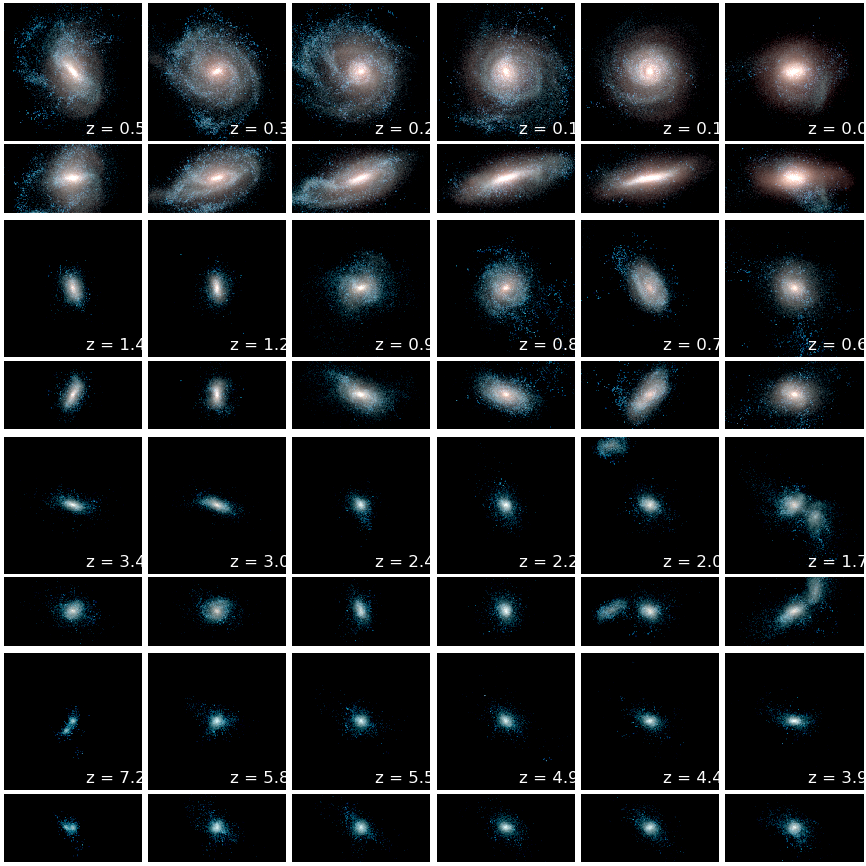
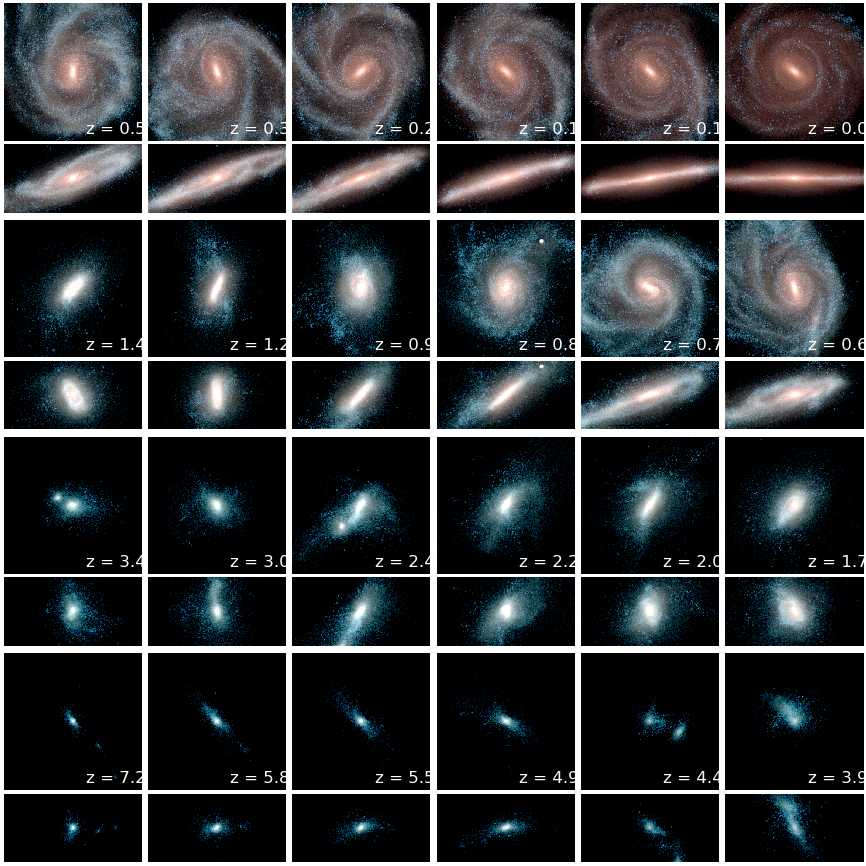
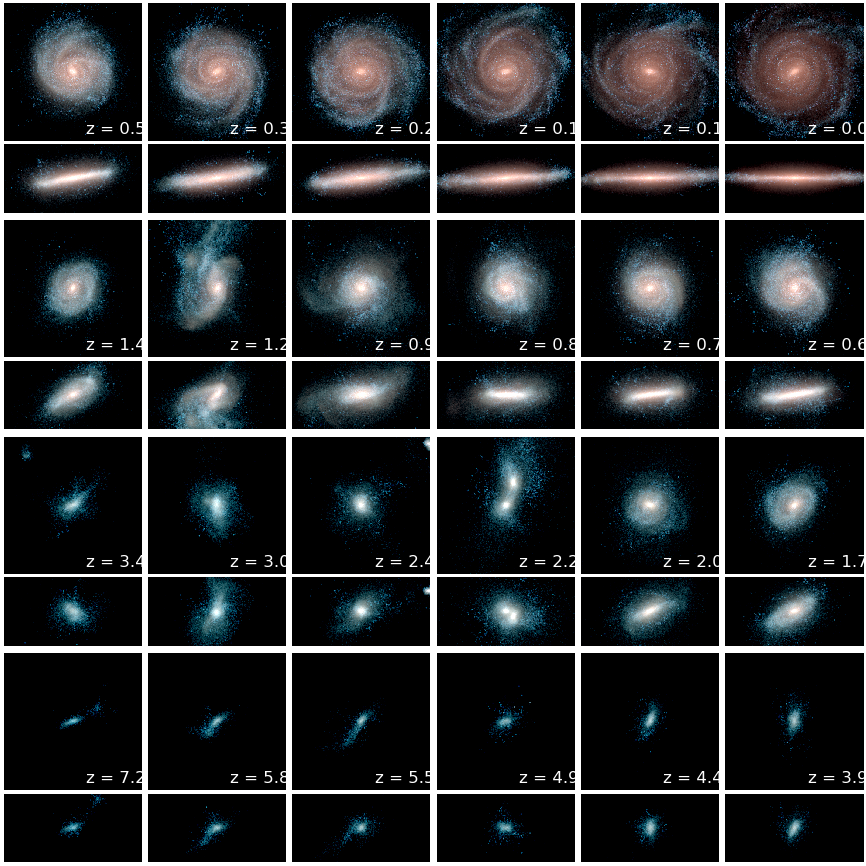
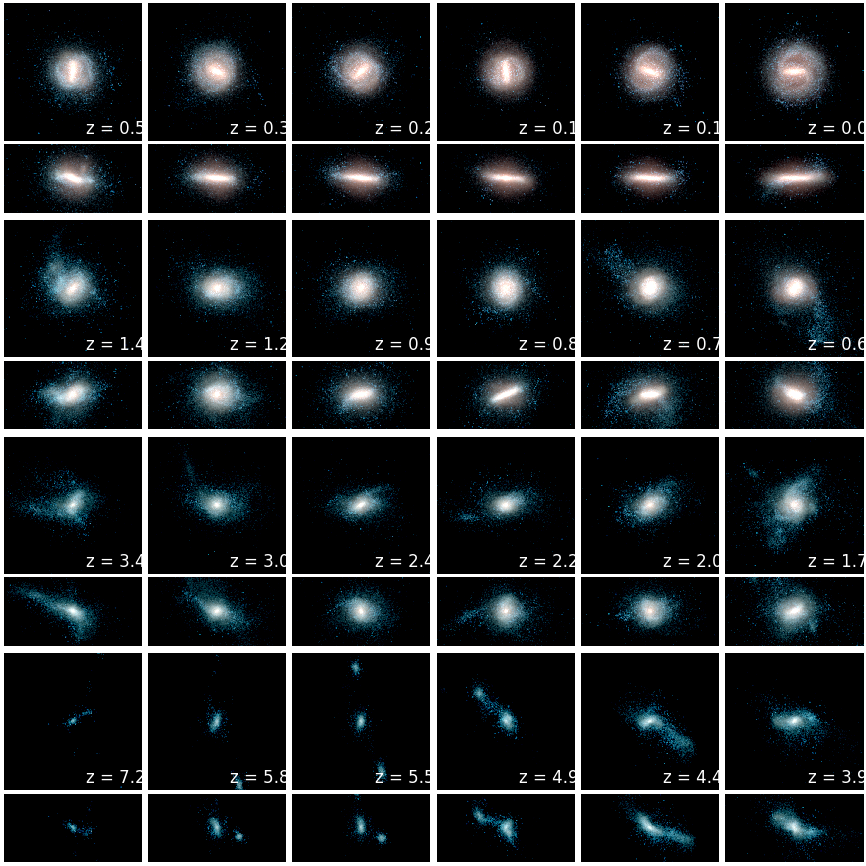
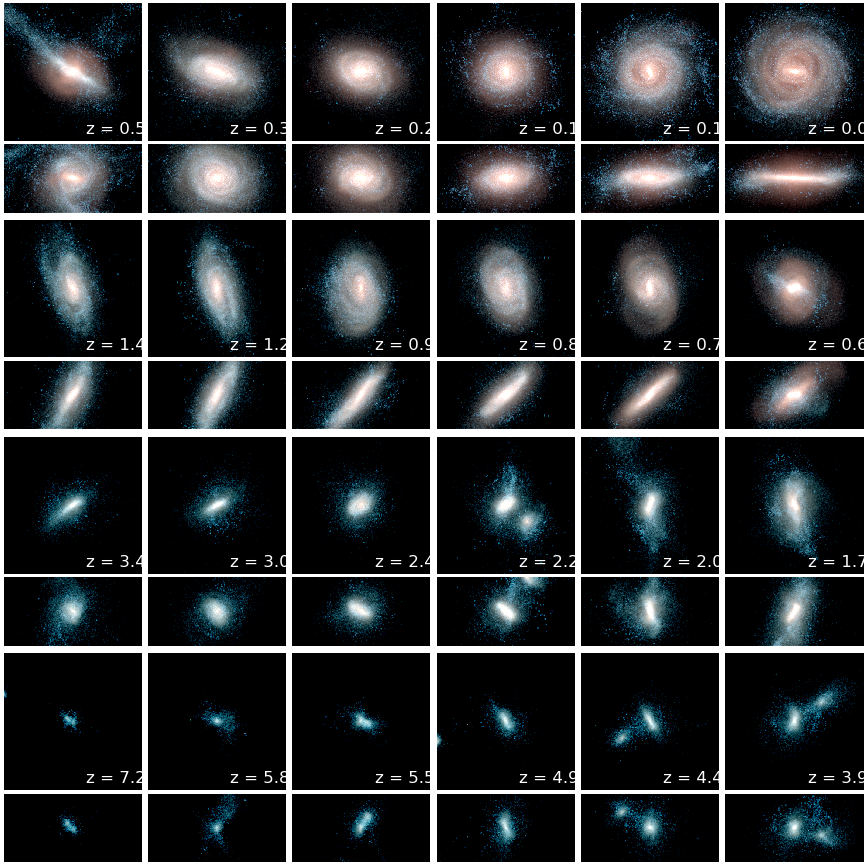
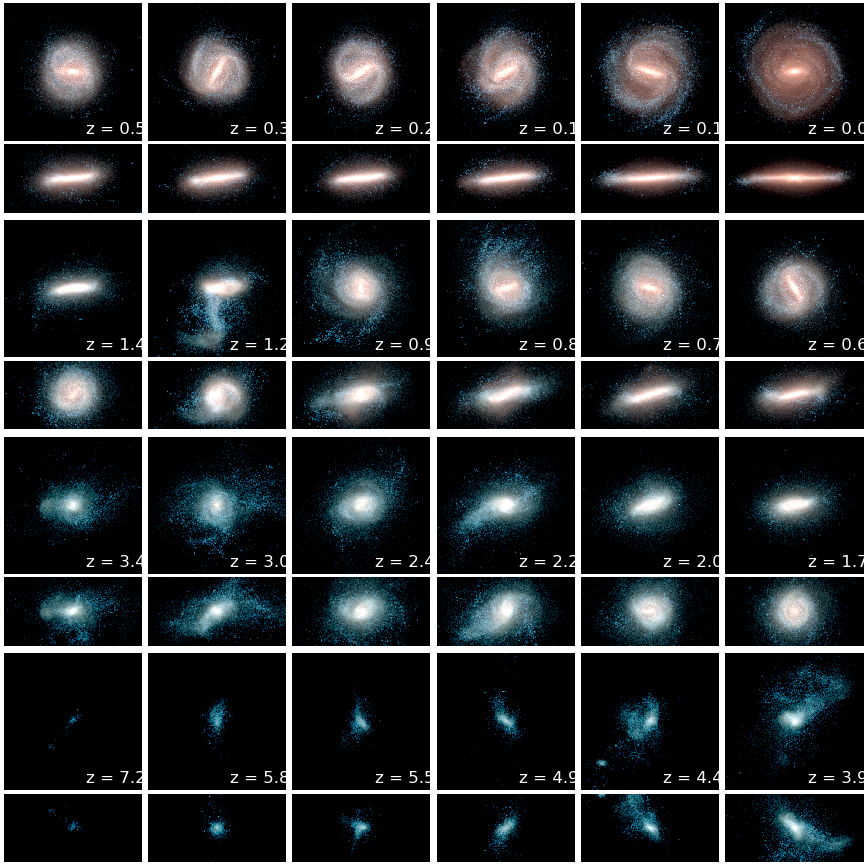
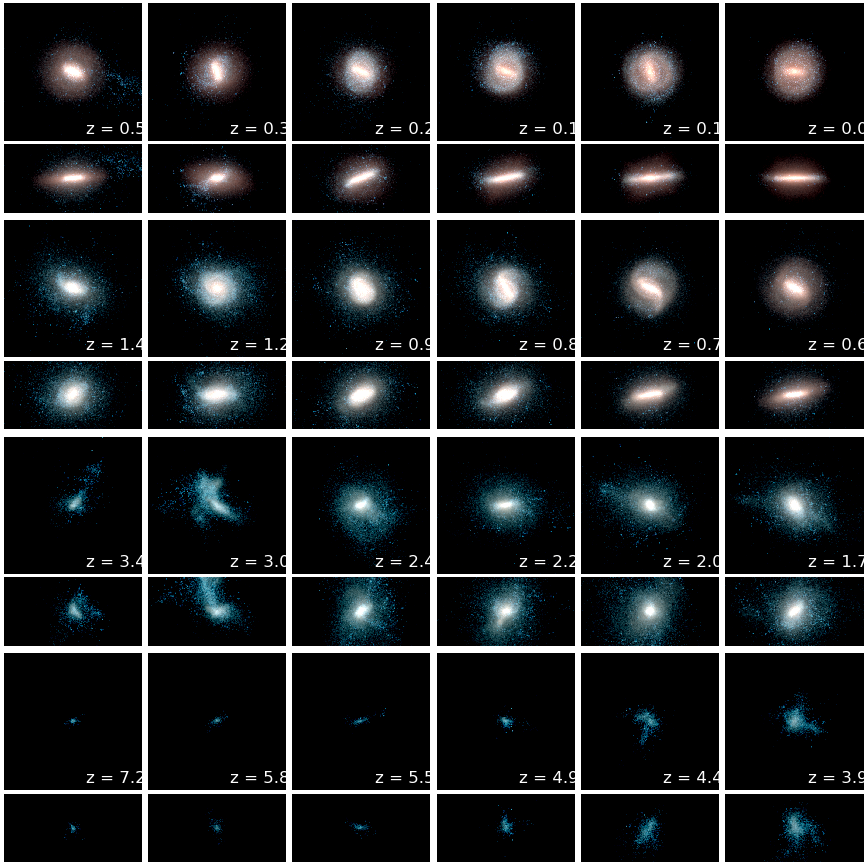
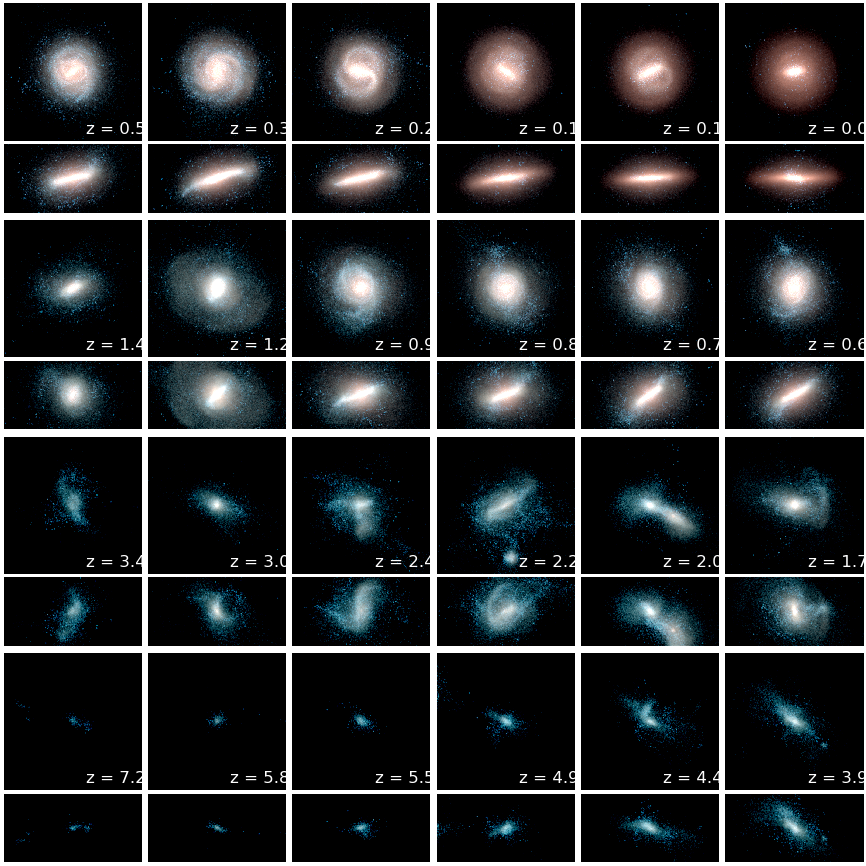
Time evolution of the stellar component of an Auriga galaxy. The 3-band image maps the K-, B- and U-band luminosities to the red, green and blue color chanels, respectively. The earliest time is the bottom-left panel, with subsequent snapshots proceeding right and then upward.
 <
>
<
>
Auriga 3
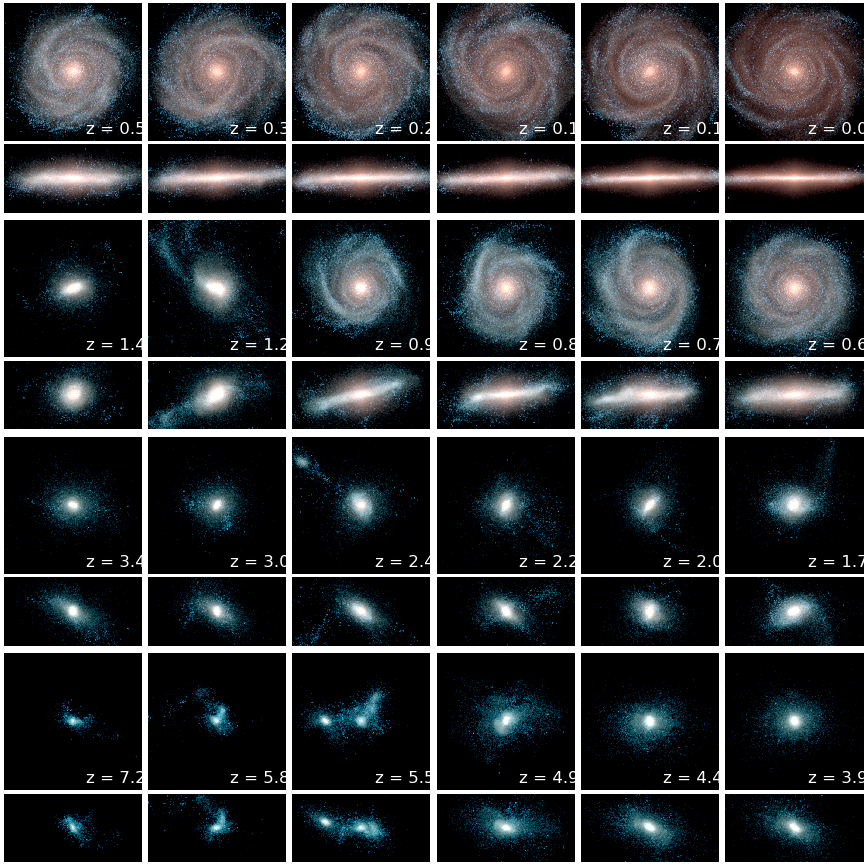
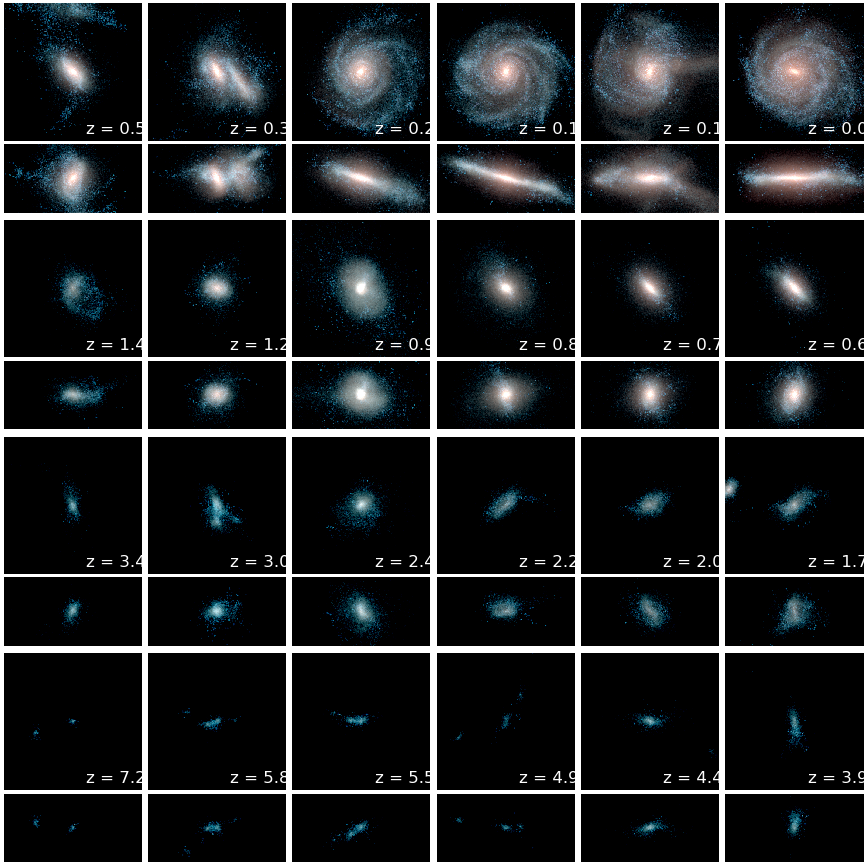
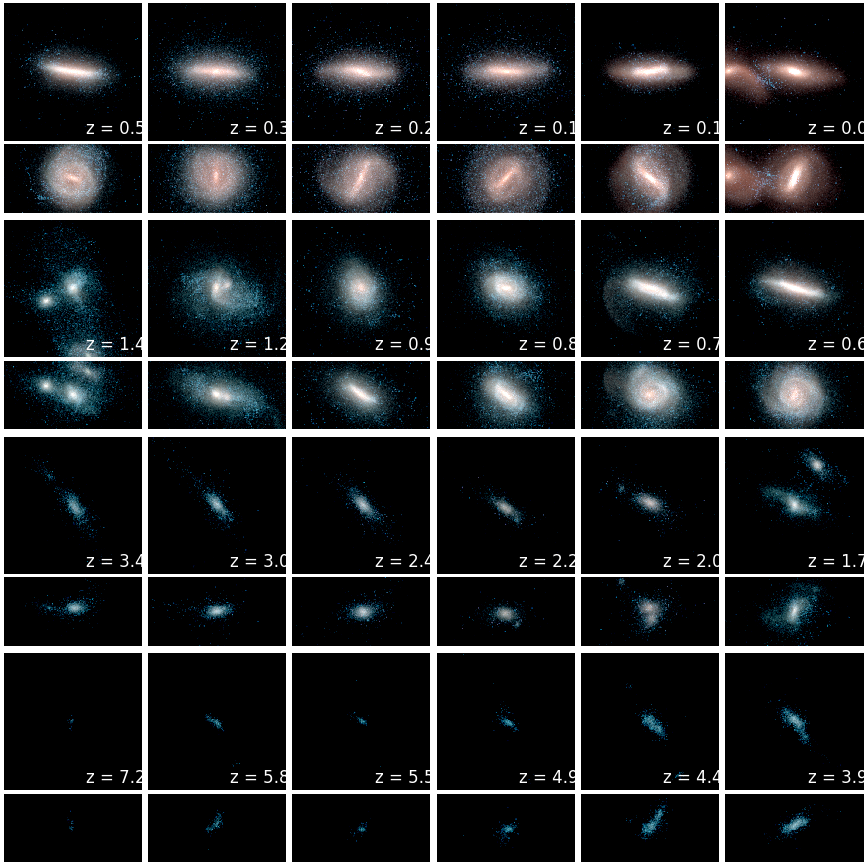
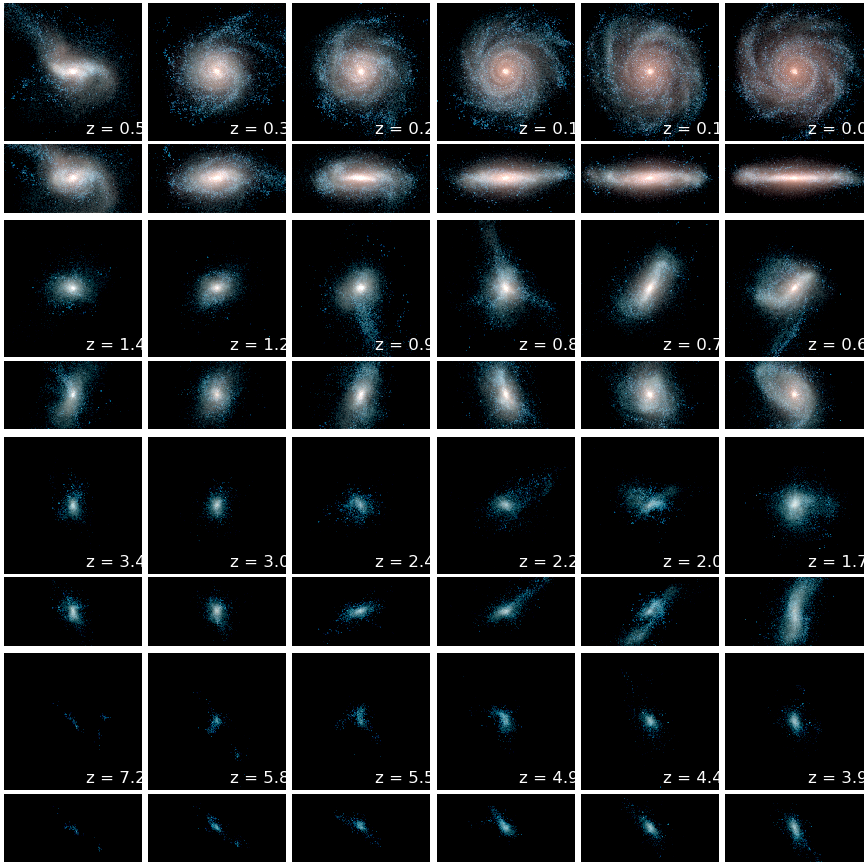
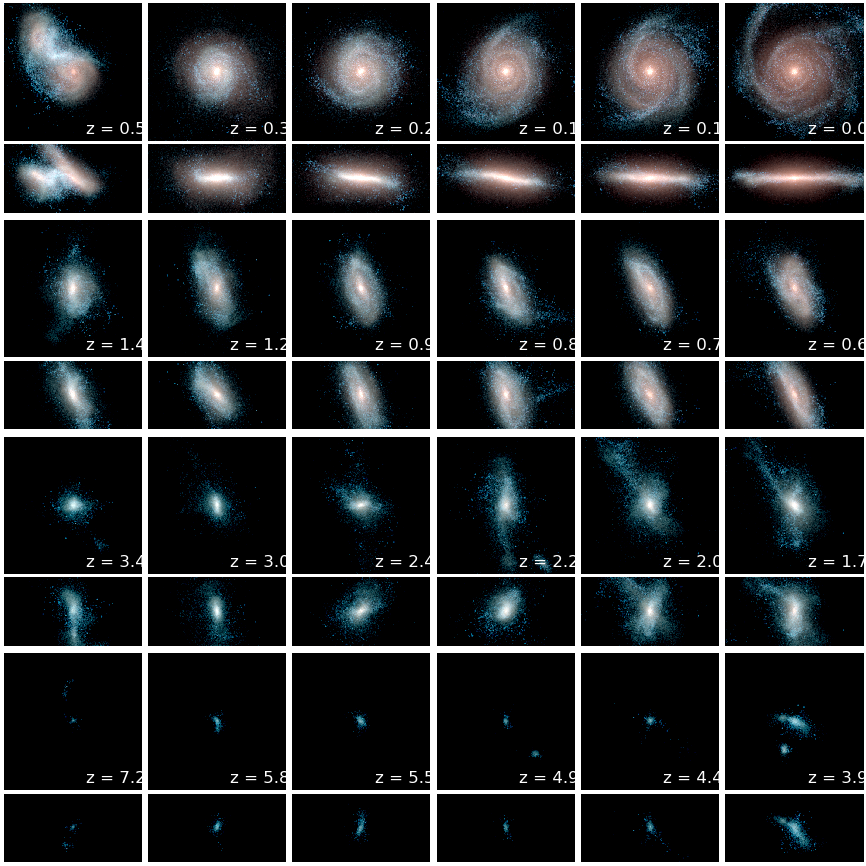
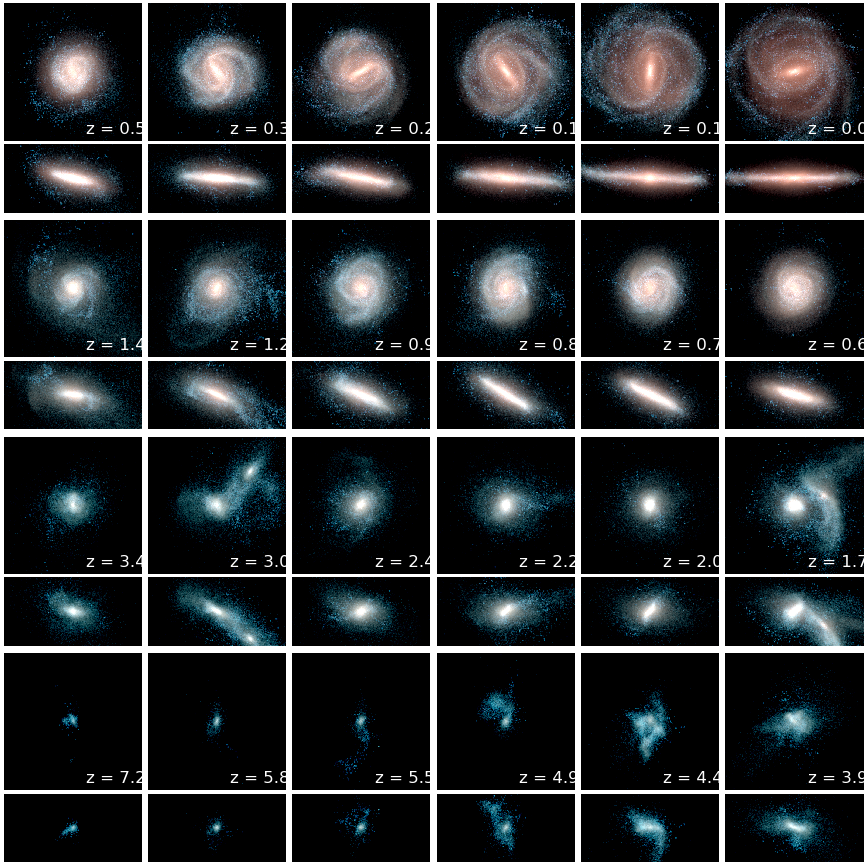
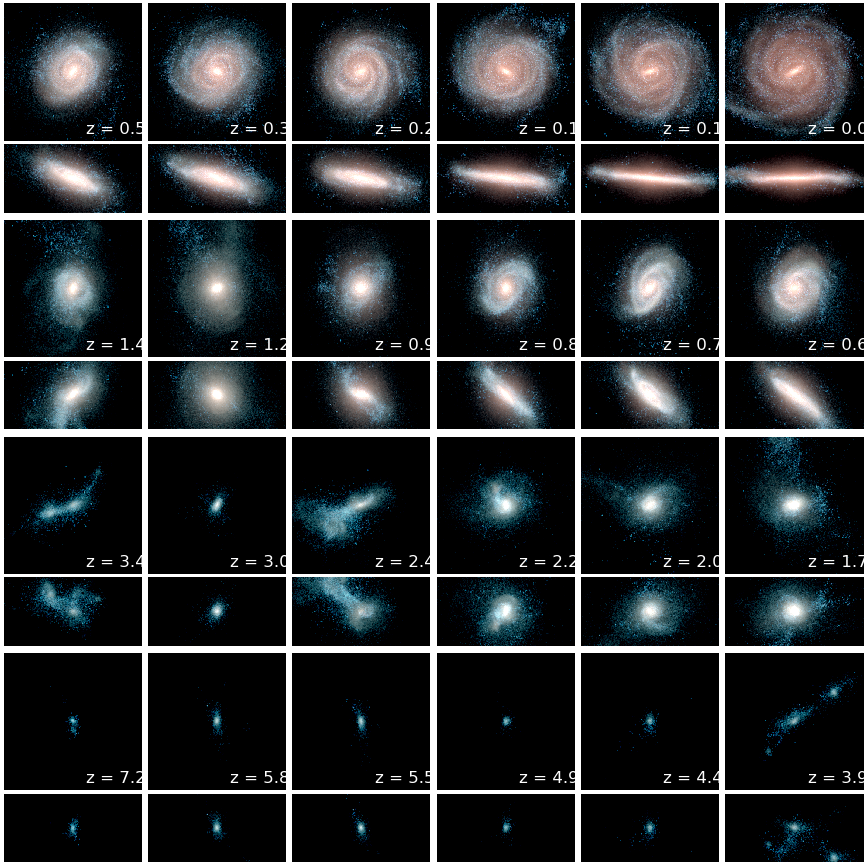
Time evolution of the stellar component of an Auriga galaxy. The 3-band image maps the K-, B- and U-band luminosities to the red, green and blue color chanels, respectively. The earliest time is the bottom-left panel, with subsequent snapshots proceeding right and then upward.
 <
>
<
>
Auriga 4
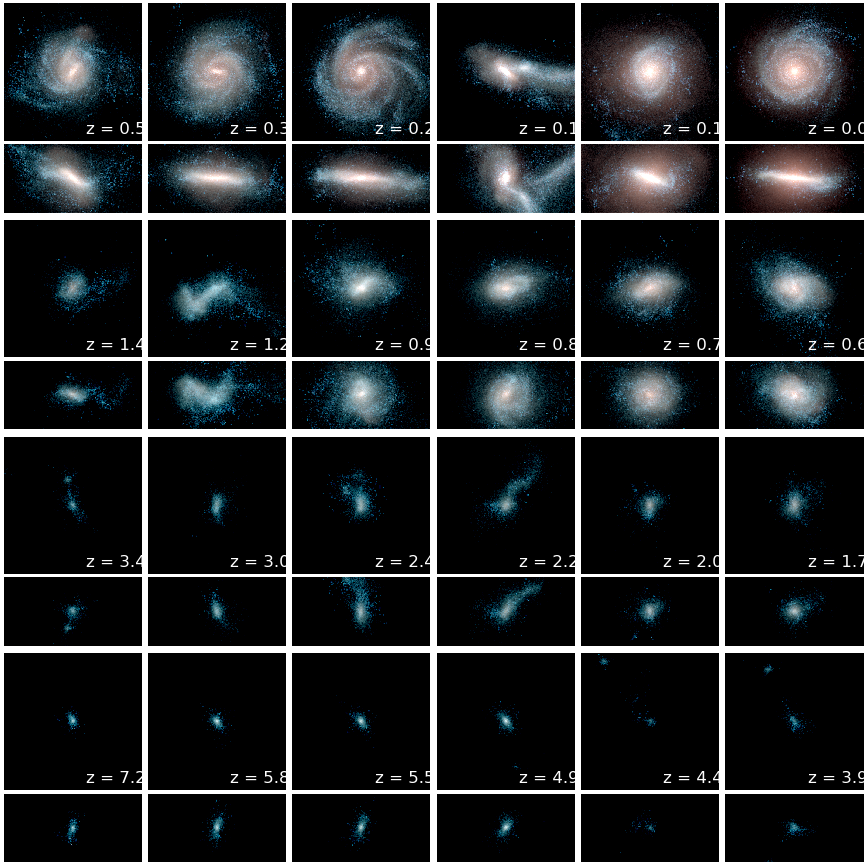
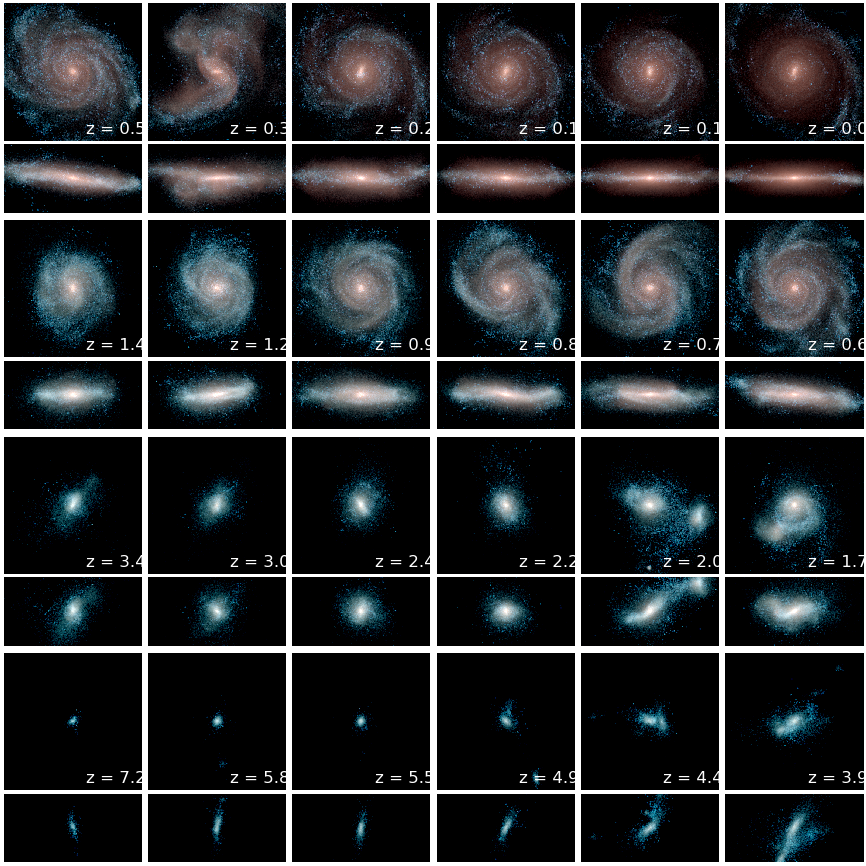
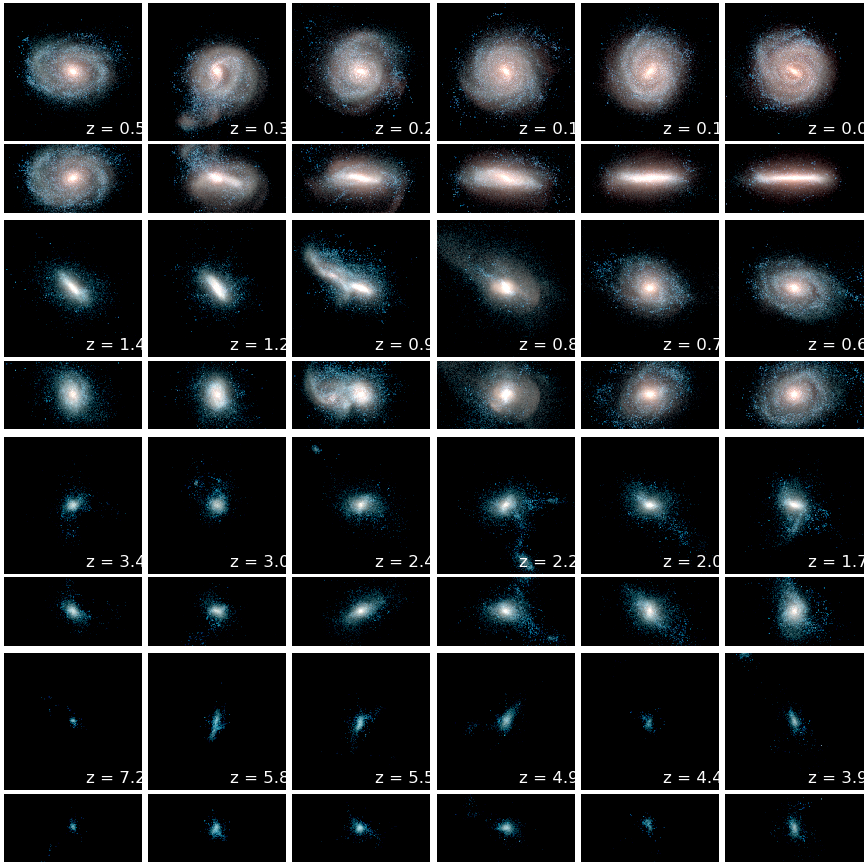
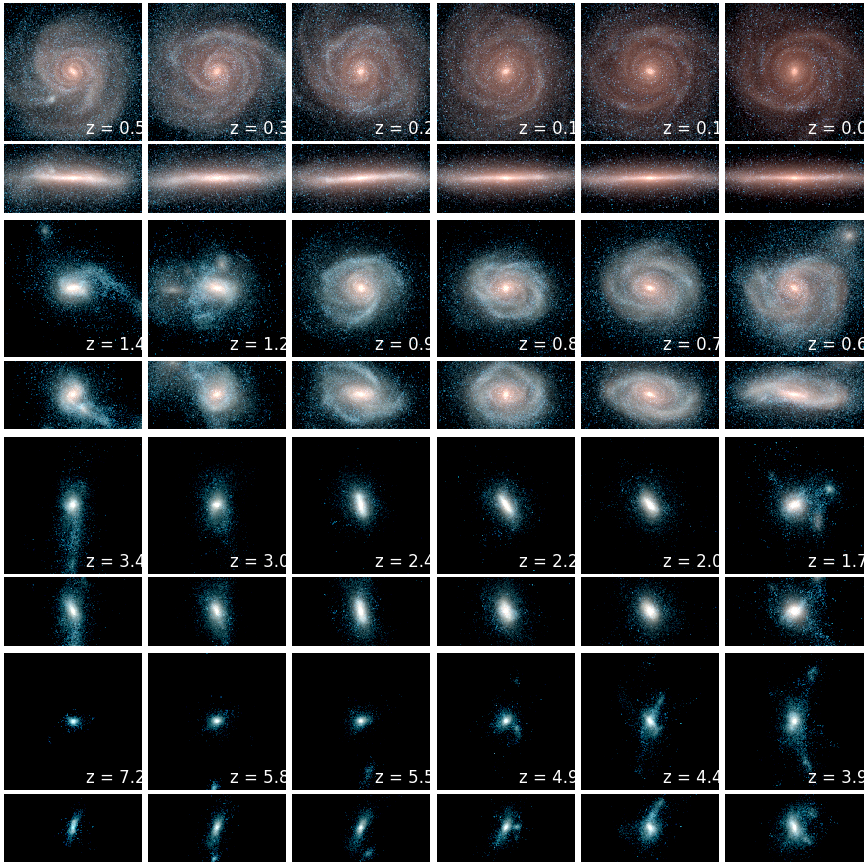
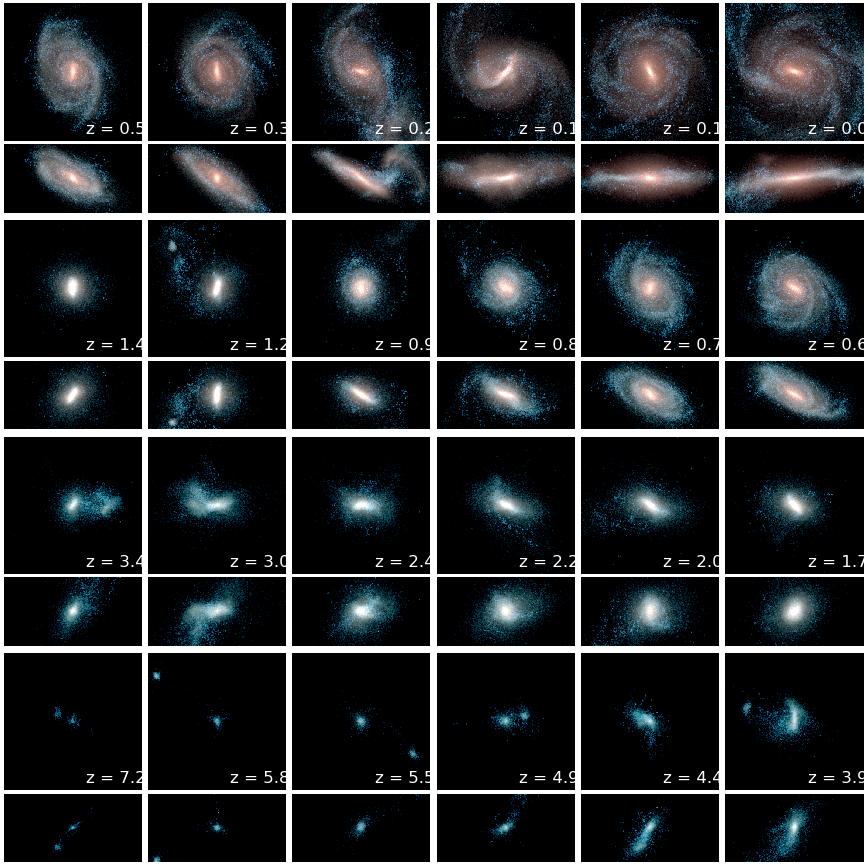
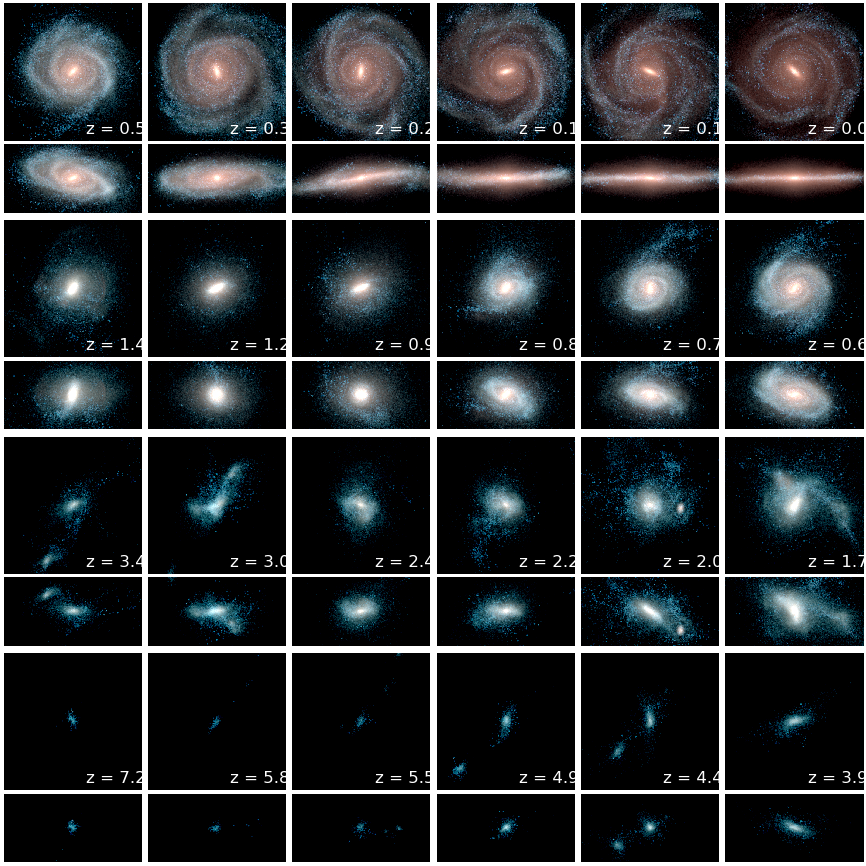
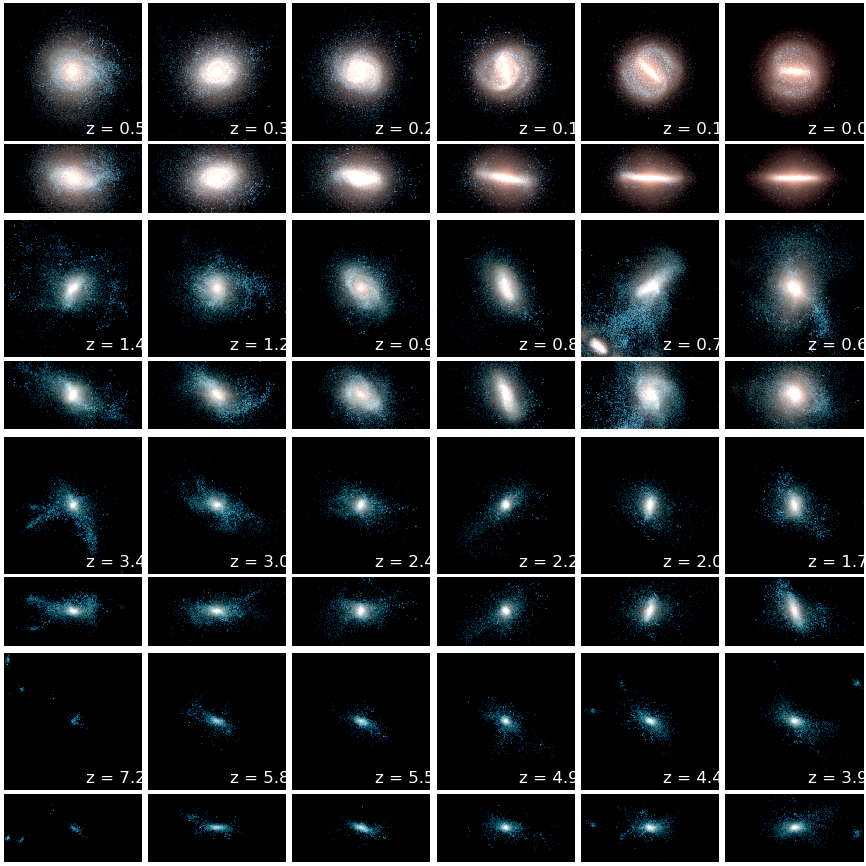
Time evolution of the stellar component of an Auriga galaxy. The 3-band image maps the K-, B- and U-band luminosities to the red, green and blue color chanels, respectively. The earliest time is the bottom-left panel, with subsequent snapshots proceeding right and then upward.
 <
>
<
>
Auriga 5
Time evolution of the stellar component of an Auriga galaxy. The 3-band image maps the K-, B- and U-band luminosities to the red, green and blue color chanels, respectively. The earliest time is the bottom-left panel, with subsequent snapshots proceeding right and then upward.
 <
>
<
>
Auriga 6
Time evolution of the stellar component of an Auriga galaxy. The 3-band image maps the K-, B- and U-band luminosities to the red, green and blue color chanels, respectively. The earliest time is the bottom-left panel, with subsequent snapshots proceeding right and then upward.
 <
>
<
>
Auriga 7
Time evolution of the stellar component of an Auriga galaxy. The 3-band image maps the K-, B- and U-band luminosities to the red, green and blue color chanels, respectively. The earliest time is the bottom-left panel, with subsequent snapshots proceeding right and then upward.
 <
>
<
>
Auriga 8
Time evolution of the stellar component of an Auriga galaxy. The 3-band image maps the K-, B- and U-band luminosities to the red, green and blue color chanels, respectively. The earliest time is the bottom-left panel, with subsequent snapshots proceeding right and then upward.
 <
>
<
>
Auriga 9
Time evolution of the stellar component of an Auriga galaxy. The 3-band image maps the K-, B- and U-band luminosities to the red, green and blue color chanels, respectively. The earliest time is the bottom-left panel, with subsequent snapshots proceeding right and then upward.
 <
>
<
>
Auriga 10
Time evolution of the stellar component of an Auriga galaxy. The 3-band image maps the K-, B- and U-band luminosities to the red, green and blue color chanels, respectively. The earliest time is the bottom-left panel, with subsequent snapshots proceeding right and then upward.
 <
>
<
>
Auriga 11
Time evolution of the stellar component of an Auriga galaxy. The 3-band image maps the K-, B- and U-band luminosities to the red, green and blue color chanels, respectively. The earliest time is the bottom-left panel, with subsequent snapshots proceeding right and then upward.
 <
>
<
>
Auriga 12
Time evolution of the stellar component of an Auriga galaxy. The 3-band image maps the K-, B- and U-band luminosities to the red, green and blue color chanels, respectively. The earliest time is the bottom-left panel, with subsequent snapshots proceeding right and then upward.
 <
>
<
>
Auriga 13
Time evolution of the stellar component of an Auriga galaxy. The 3-band image maps the K-, B- and U-band luminosities to the red, green and blue color chanels, respectively. The earliest time is the bottom-left panel, with subsequent snapshots proceeding right and then upward.
 <
>
<
>
Auriga 14
Time evolution of the stellar component of an Auriga galaxy. The 3-band image maps the K-, B- and U-band luminosities to the red, green and blue color chanels, respectively. The earliest time is the bottom-left panel, with subsequent snapshots proceeding right and then upward.
 <
>
<
>
Auriga 15
Time evolution of the stellar component of an Auriga galaxy. The 3-band image maps the K-, B- and U-band luminosities to the red, green and blue color chanels, respectively. The earliest time is the bottom-left panel, with subsequent snapshots proceeding right and then upward.
 <
>
<
>
Auriga 16
Time evolution of the stellar component of an Auriga galaxy. The 3-band image maps the K-, B- and U-band luminosities to the red, green and blue color chanels, respectively. The earliest time is the bottom-left panel, with subsequent snapshots proceeding right and then upward.
 <
>
<
>
Auriga 17
Time evolution of the stellar component of an Auriga galaxy. The 3-band image maps the K-, B- and U-band luminosities to the red, green and blue color chanels, respectively. The earliest time is the bottom-left panel, with subsequent snapshots proceeding right and then upward.
 <
>
<
>
Auriga 18
Time evolution of the stellar component of an Auriga galaxy. The 3-band image maps the K-, B- and U-band luminosities to the red, green and blue color chanels, respectively. The earliest time is the bottom-left panel, with subsequent snapshots proceeding right and then upward.
 <
>
<
>
Auriga 19
Time evolution of the stellar component of an Auriga galaxy. The 3-band image maps the K-, B- and U-band luminosities to the red, green and blue color chanels, respectively. The earliest time is the bottom-left panel, with subsequent snapshots proceeding right and then upward.
 <
>
<
>
Auriga 20
Time evolution of the stellar component of an Auriga galaxy. The 3-band image maps the K-, B- and U-band luminosities to the red, green and blue color chanels, respectively. The earliest time is the bottom-left panel, with subsequent snapshots proceeding right and then upward.
 <
>
<
>
Auriga 21
Time evolution of the stellar component of an Auriga galaxy. The 3-band image maps the K-, B- and U-band luminosities to the red, green and blue color chanels, respectively. The earliest time is the bottom-left panel, with subsequent snapshots proceeding right and then upward.
 <
>
<
>
Auriga 22
Time evolution of the stellar component of an Auriga galaxy. The 3-band image maps the K-, B- and U-band luminosities to the red, green and blue color chanels, respectively. The earliest time is the bottom-left panel, with subsequent snapshots proceeding right and then upward.
 <
>
<
>
Auriga 23
Time evolution of the stellar component of an Auriga galaxy. The 3-band image maps the K-, B- and U-band luminosities to the red, green and blue color chanels, respectively. The earliest time is the bottom-left panel, with subsequent snapshots proceeding right and then upward.
 <
>
<
>
Auriga 24
Time evolution of the stellar component of an Auriga galaxy. The 3-band image maps the K-, B- and U-band luminosities to the red, green and blue color chanels, respectively. The earliest time is the bottom-left panel, with subsequent snapshots proceeding right and then upward.
 <
>
<
>
Auriga 25
Time evolution of the stellar component of an Auriga galaxy. The 3-band image maps the K-, B- and U-band luminosities to the red, green and blue color chanels, respectively. The earliest time is the bottom-left panel, with subsequent snapshots proceeding right and then upward.
 <
>
<
>
Auriga 26
Time evolution of the stellar component of an Auriga galaxy. The 3-band image maps the K-, B- and U-band luminosities to the red, green and blue color chanels, respectively. The earliest time is the bottom-left panel, with subsequent snapshots proceeding right and then upward.
 <
>
<
>
Auriga 27
Time evolution of the stellar component of an Auriga galaxy. The 3-band image maps the K-, B- and U-band luminosities to the red, green and blue color chanels, respectively. The earliest time is the bottom-left panel, with subsequent snapshots proceeding right and then upward.
 <
>
<
>
Auriga 28
Time evolution of the stellar component of an Auriga galaxy. The 3-band image maps the K-, B- and U-band luminosities to the red, green and blue color chanels, respectively. The earliest time is the bottom-left panel, with subsequent snapshots proceeding right and then upward.

Projections of the gas density (left), temperature (middle) and gas metallicity (right) of the high resolution level 3 simulation of Au 6, at three different redshifts.
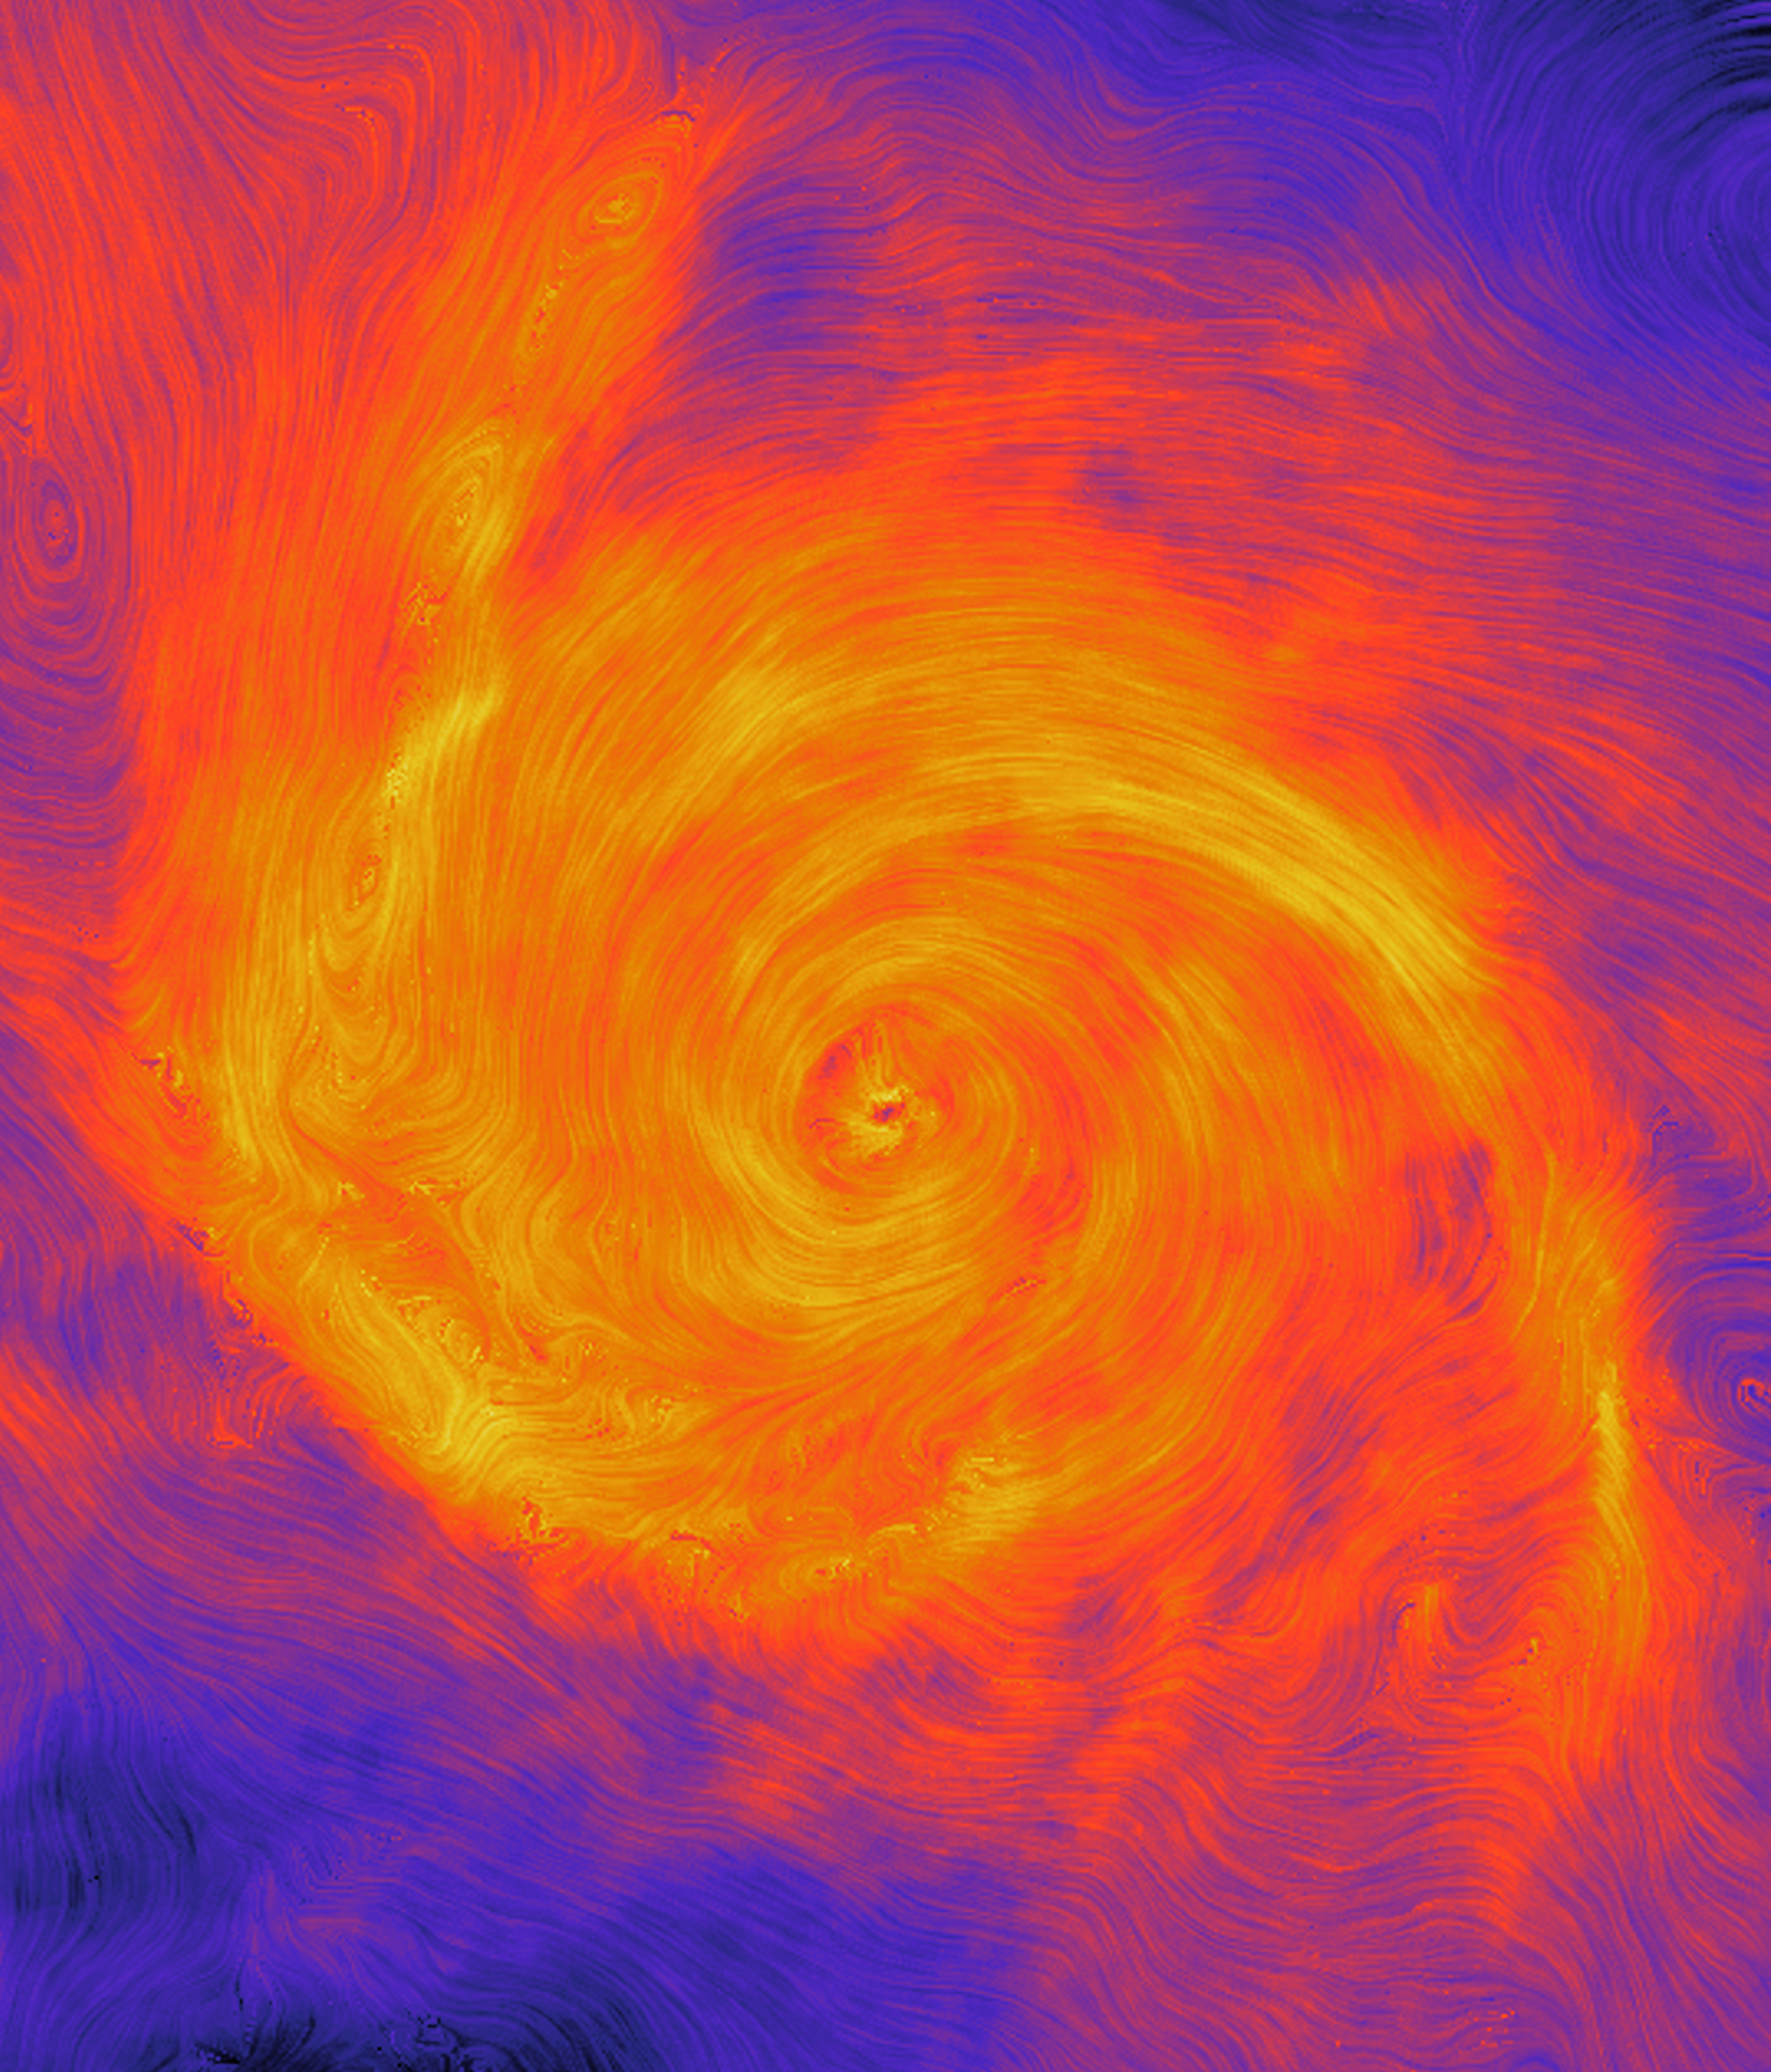
Magnetic field strength of a spiral galaxy with brush strokes to indicate the direction of the field lines.
Movie showing the evolution of one of the simulations from very high redshift to present day. The movie fades between dark matter density, gas density, stars, metallicity and magnetic field strength. In the last of these, field lines indicate the directions of the magnetic field. Click here to see a higher resolution version, and here to see an even higher resolution version!
Movie showing the evolution of a simulated halo from very early times to the present day, showing dark matter density (left), gas density (middle), stars (right).
Virtual Reality movie showing the evolution of a simulated Milky Way-like galaxy from early times to the present day. Particular focus on an early merger and late-time bar and spiral arm formation.
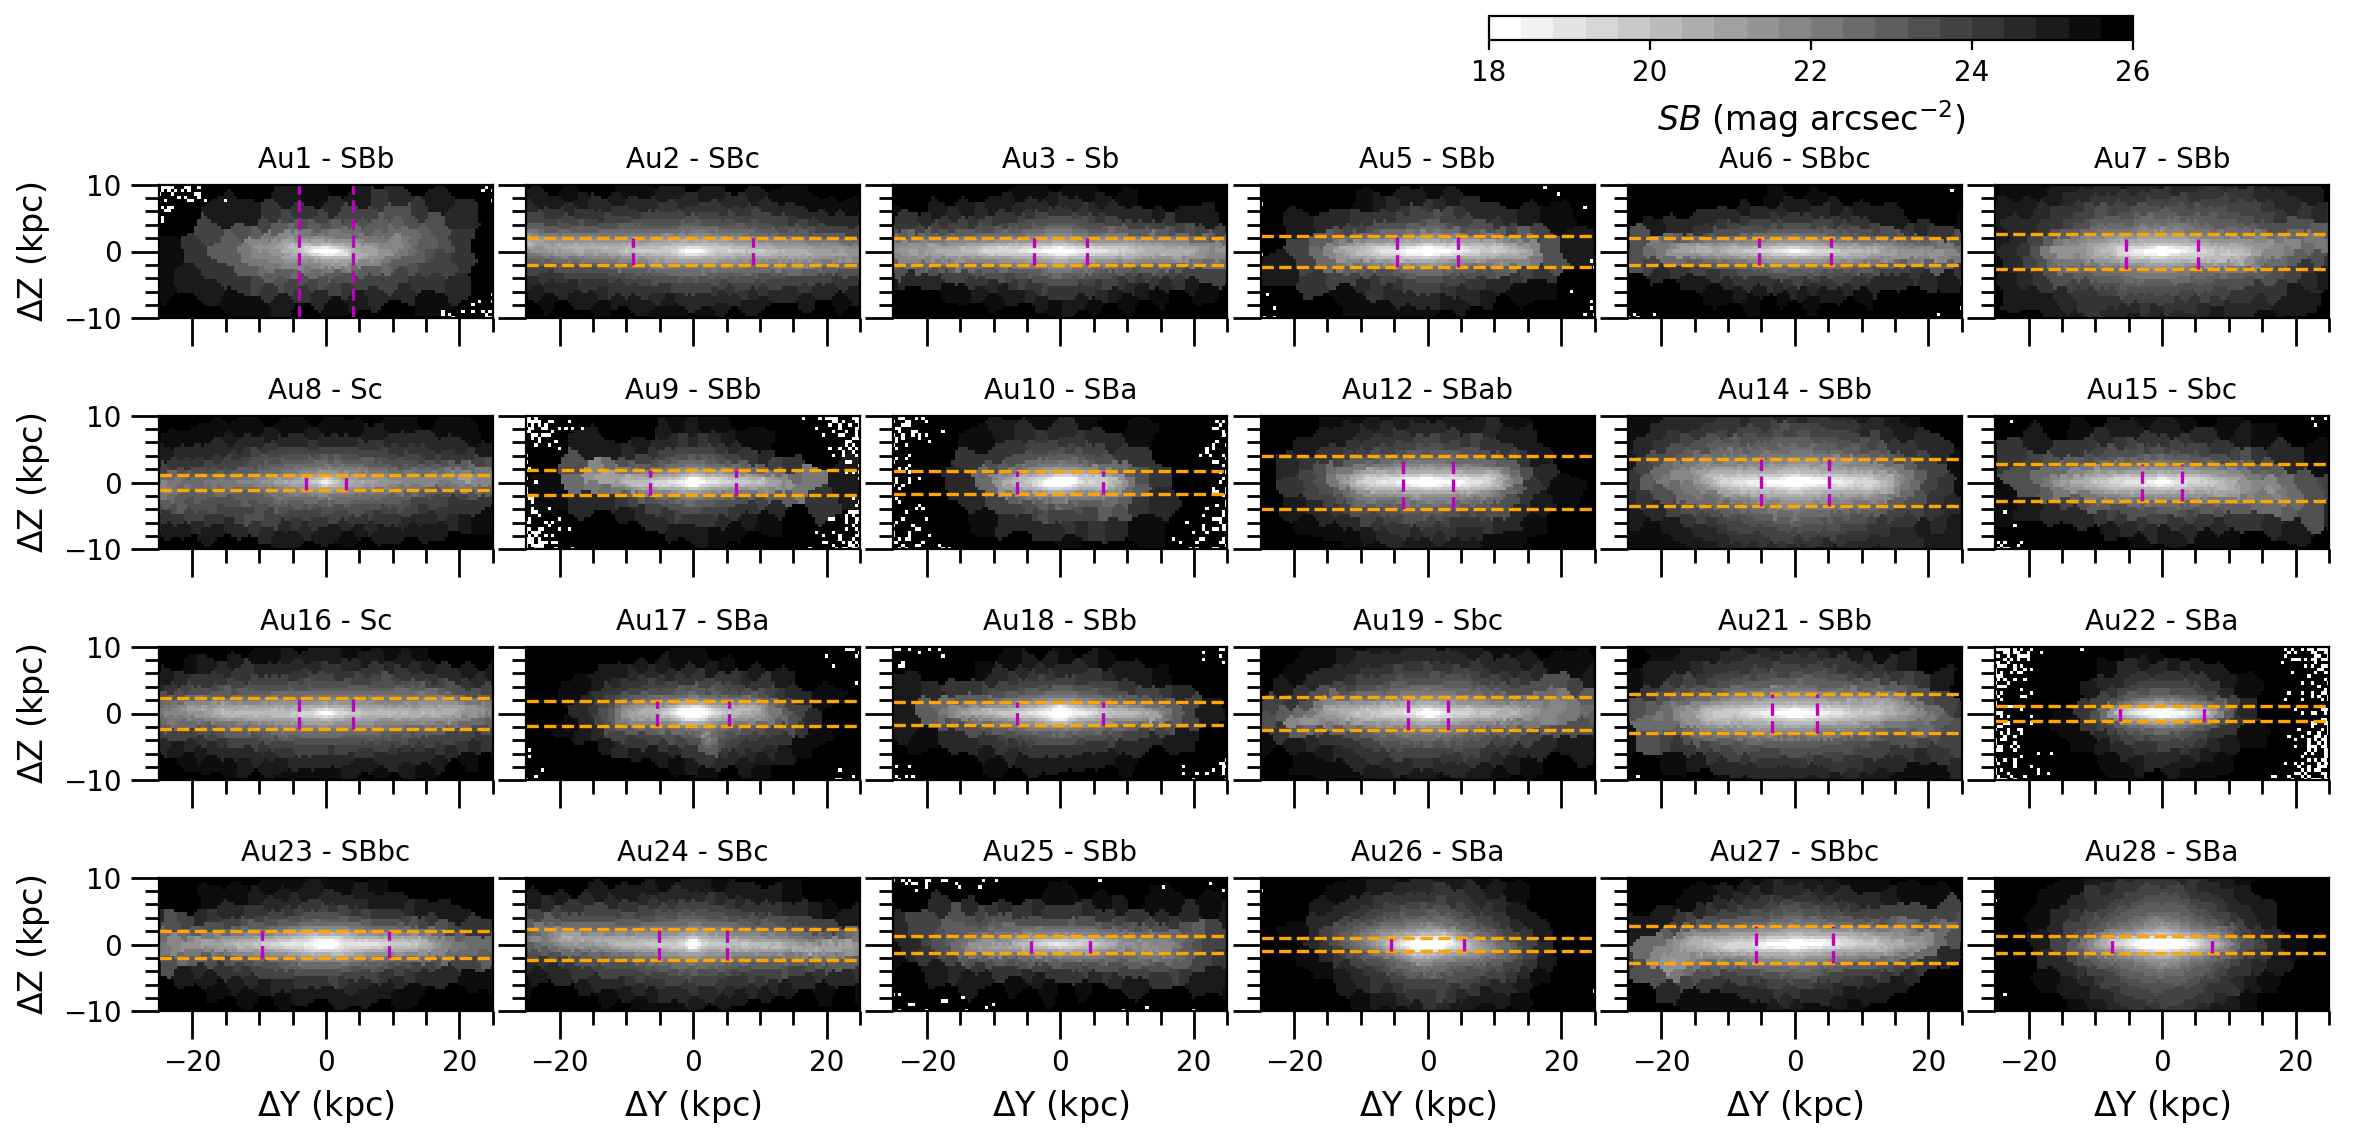
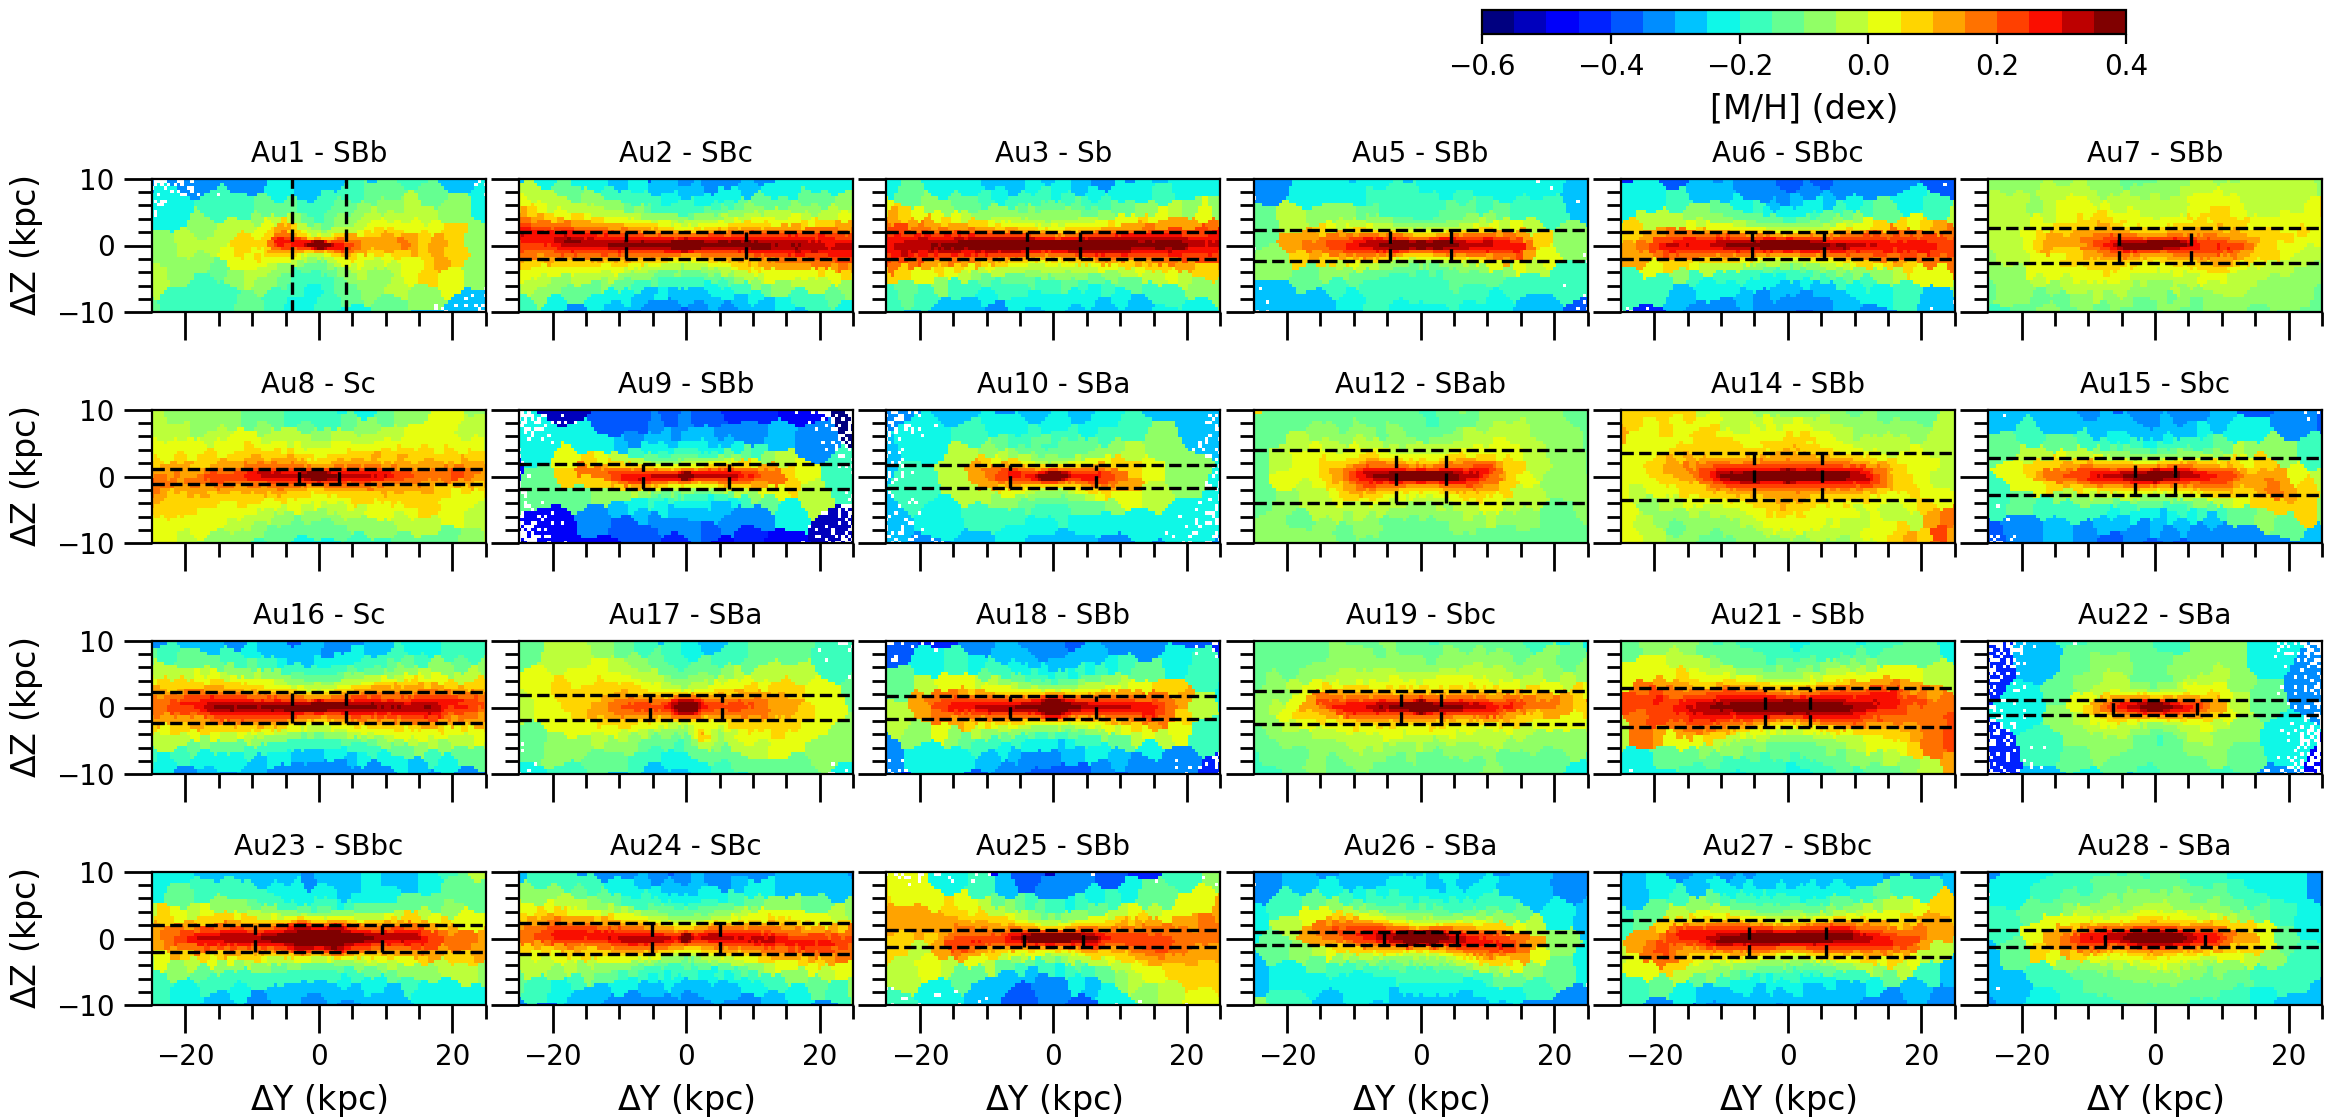
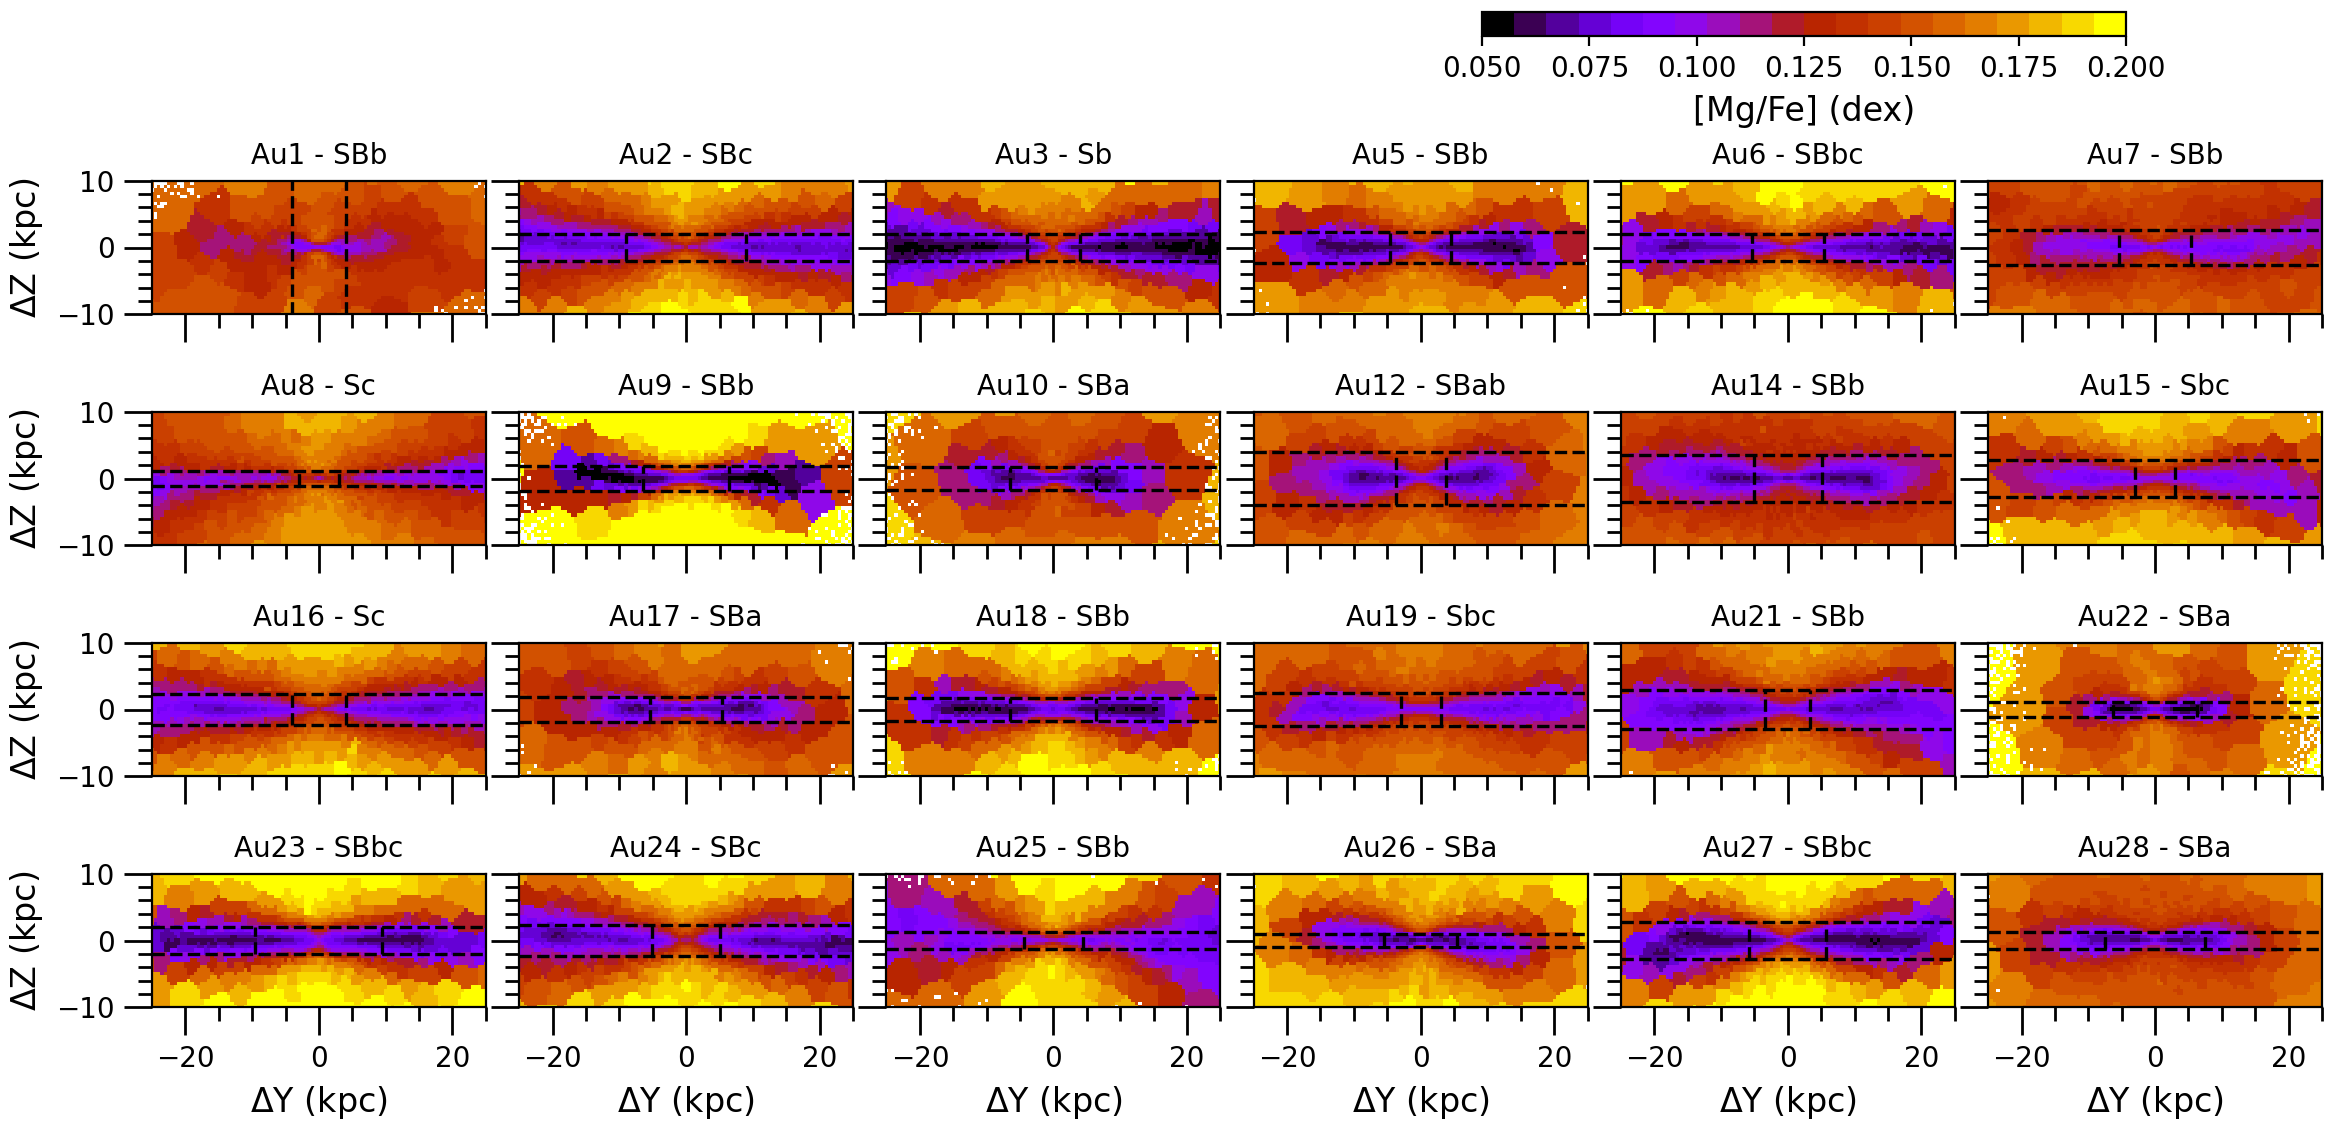
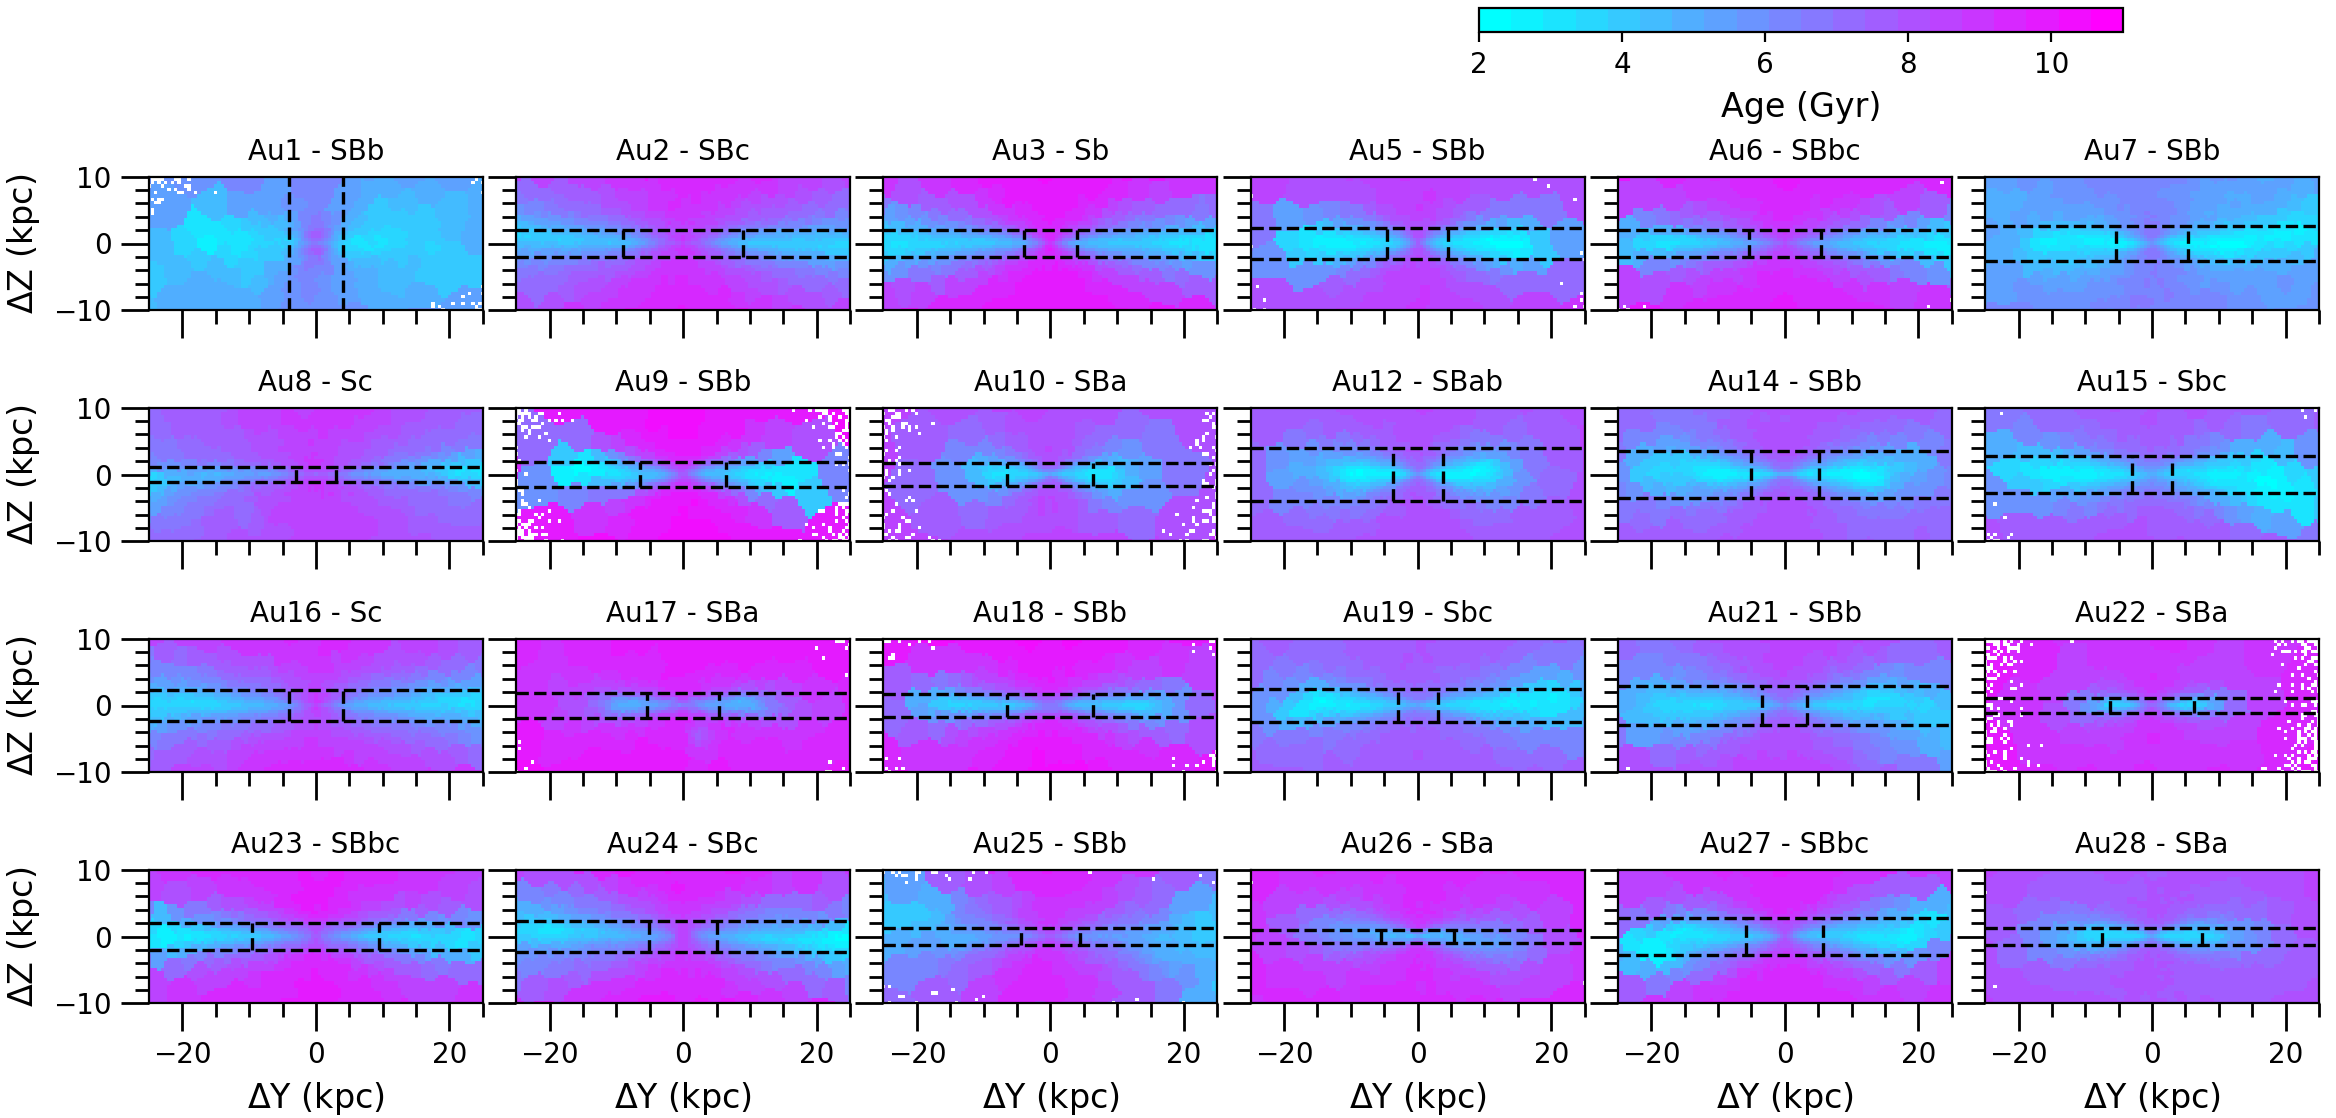
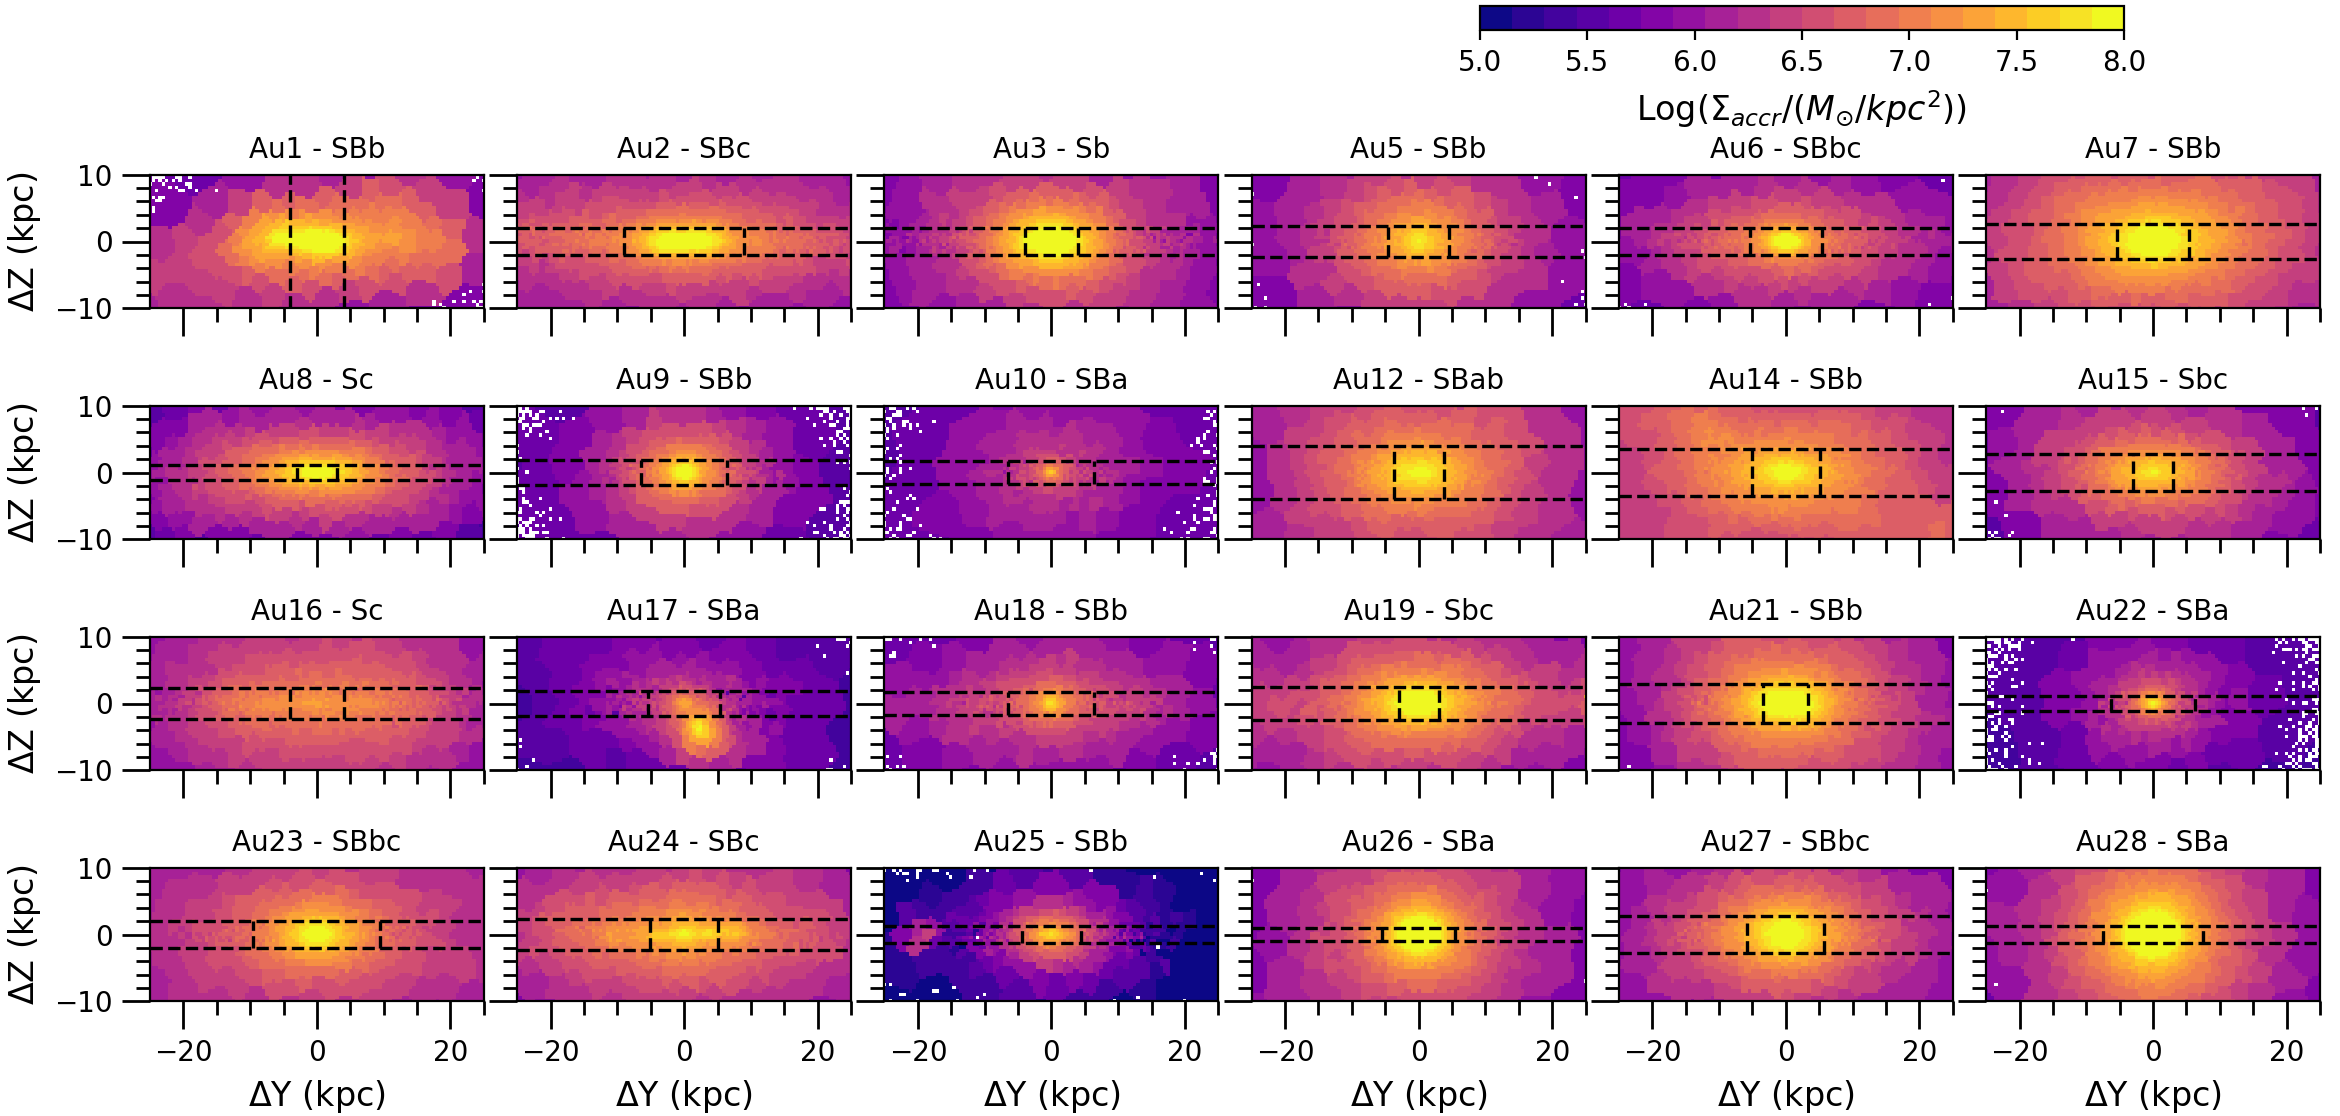
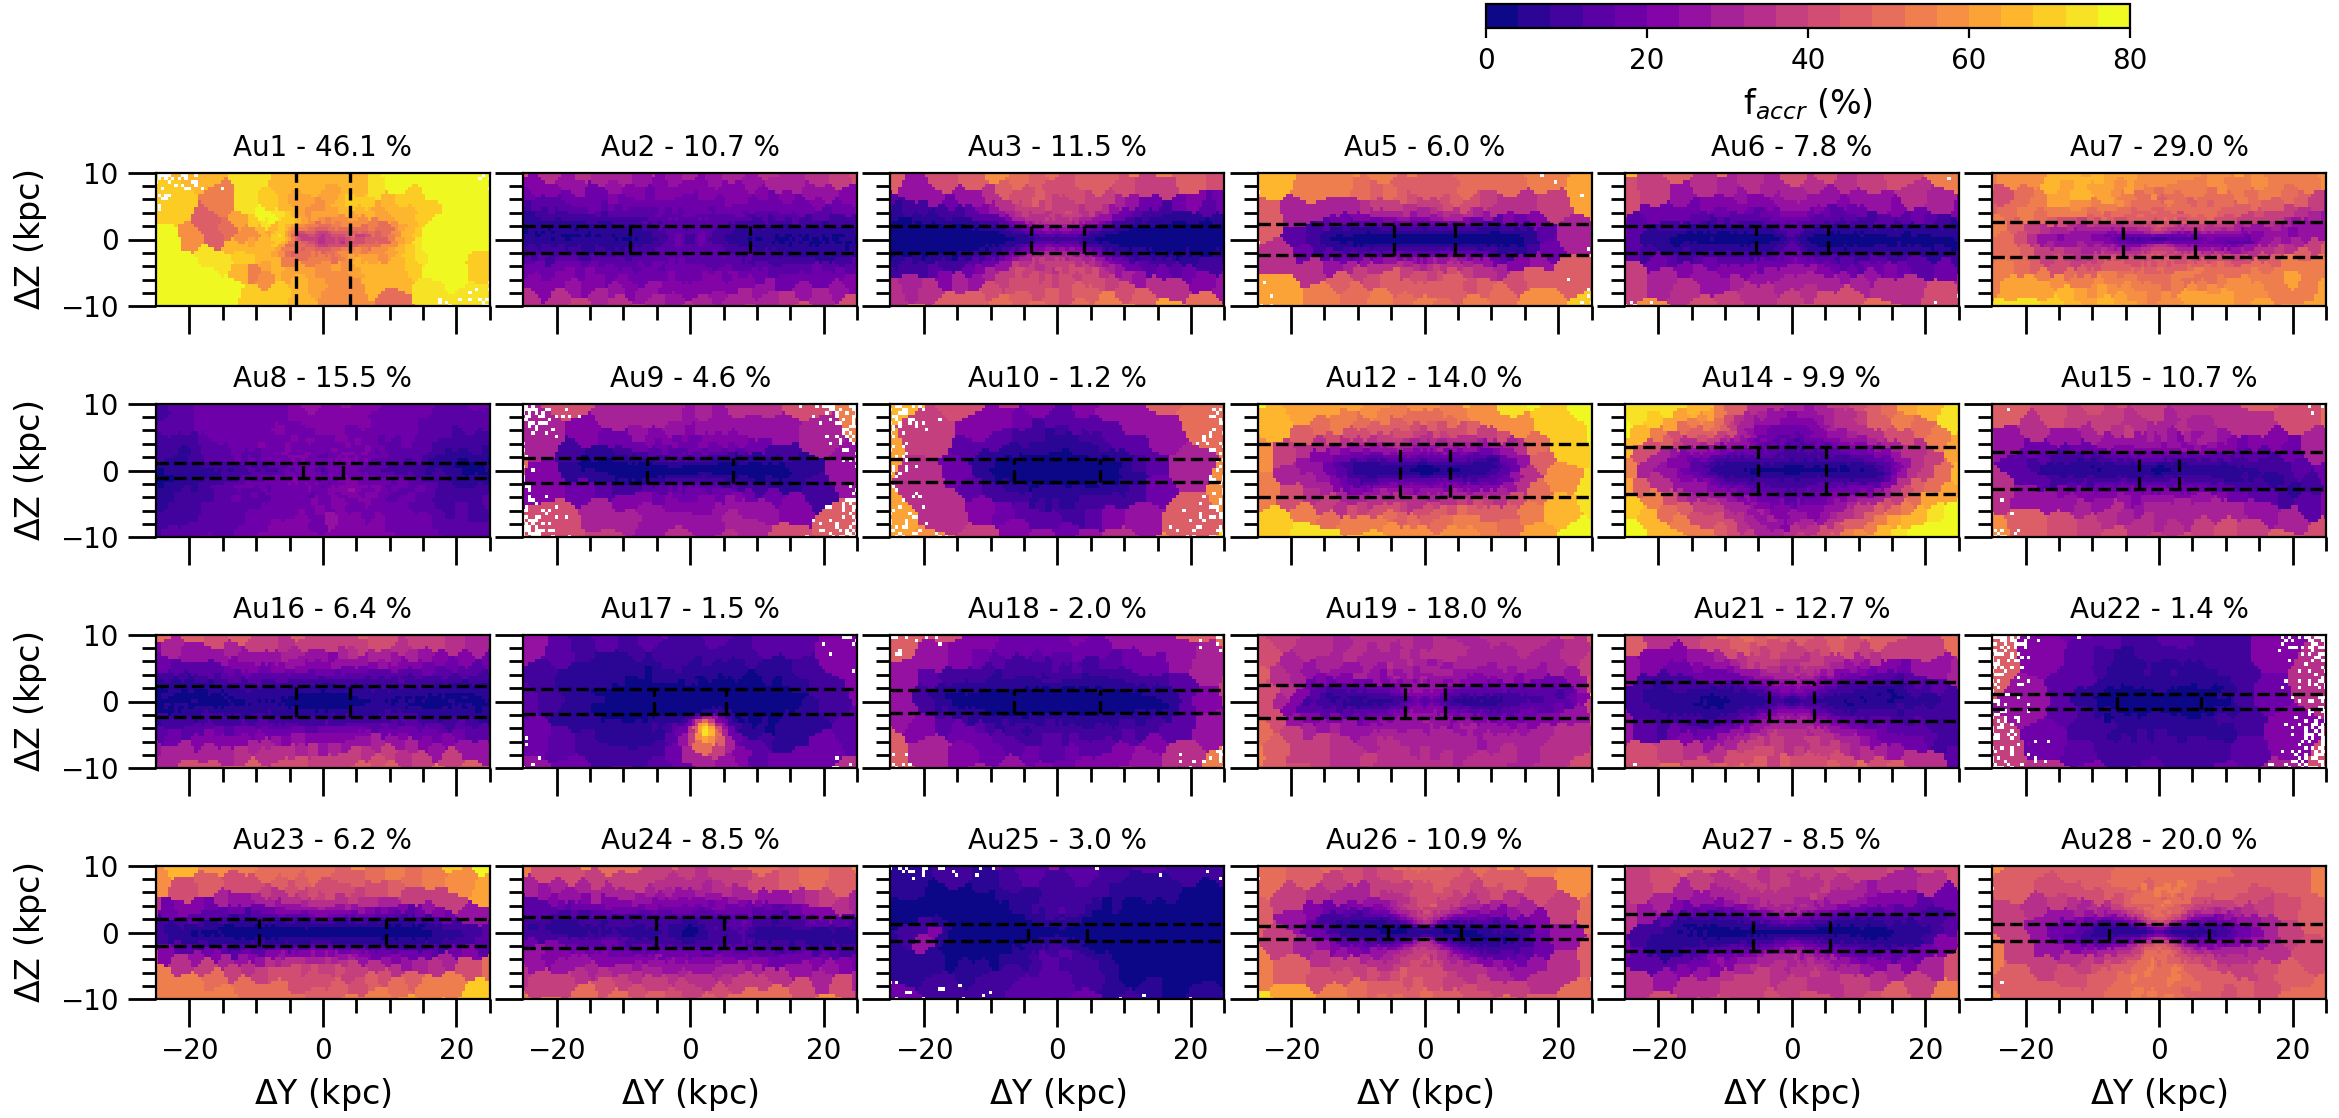
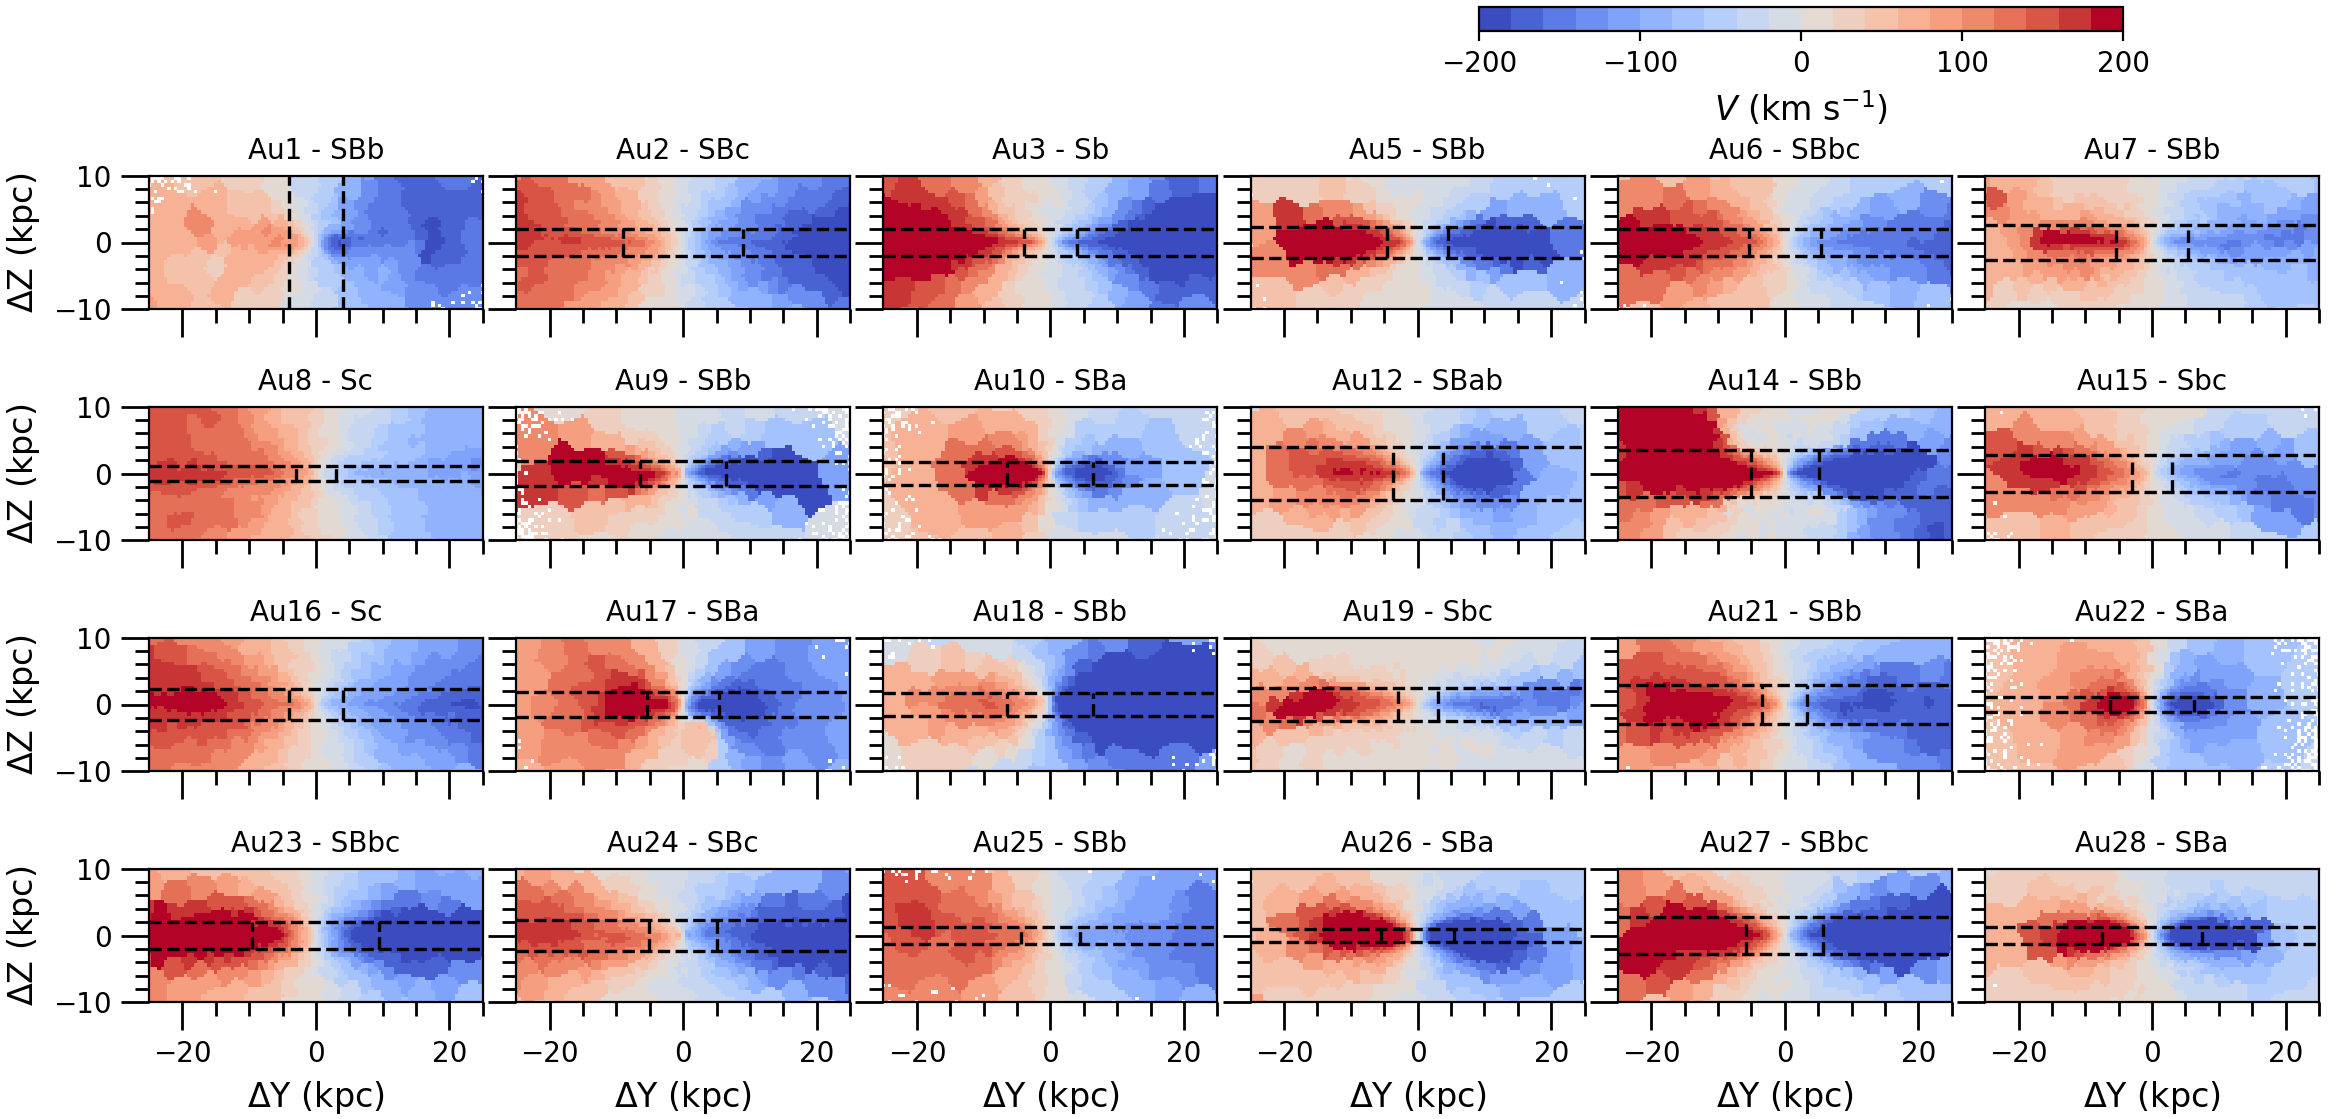
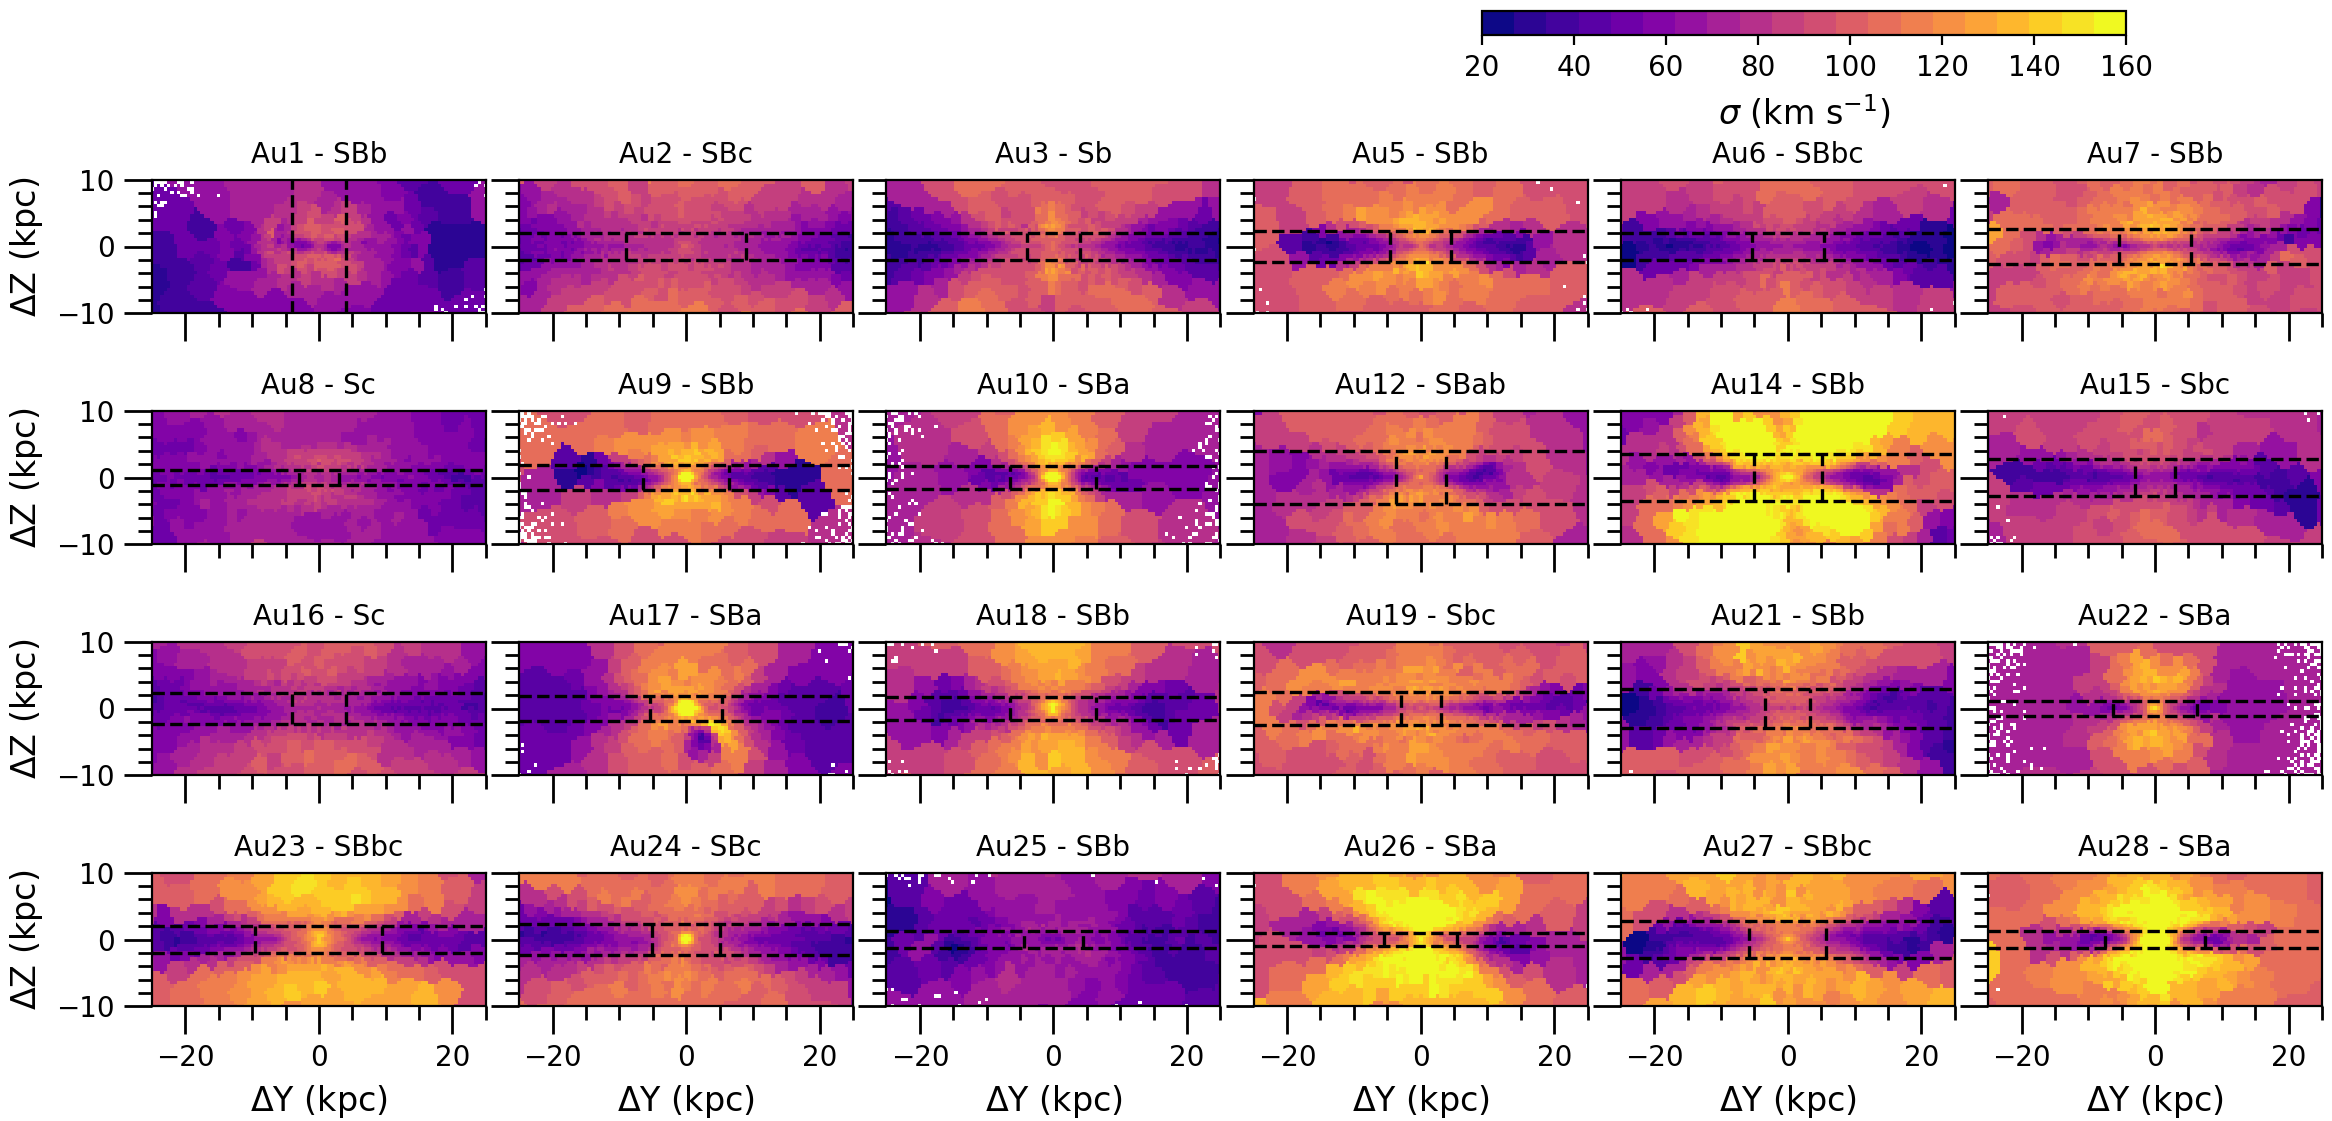
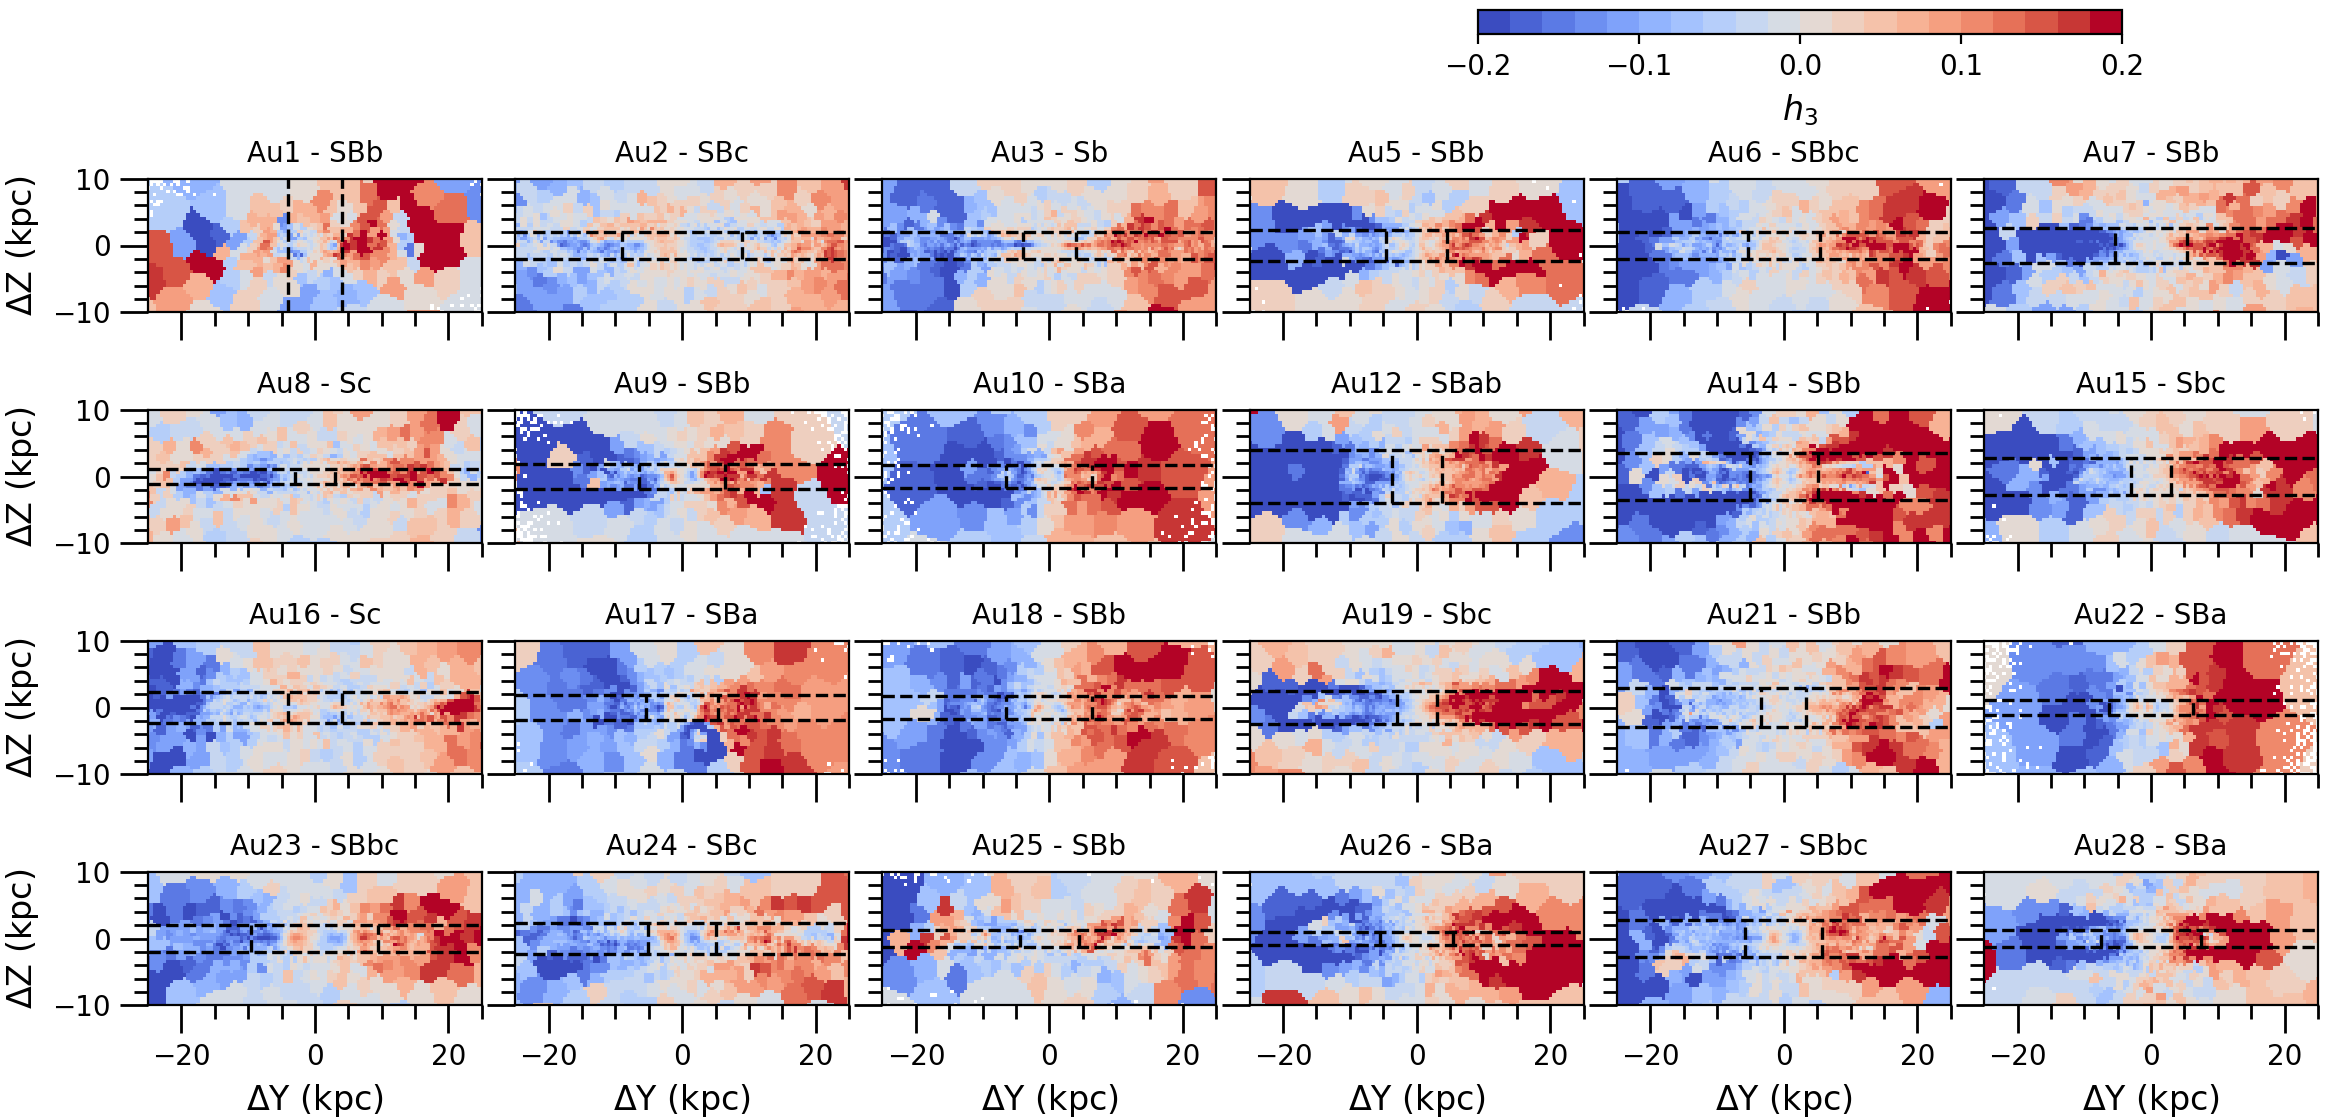
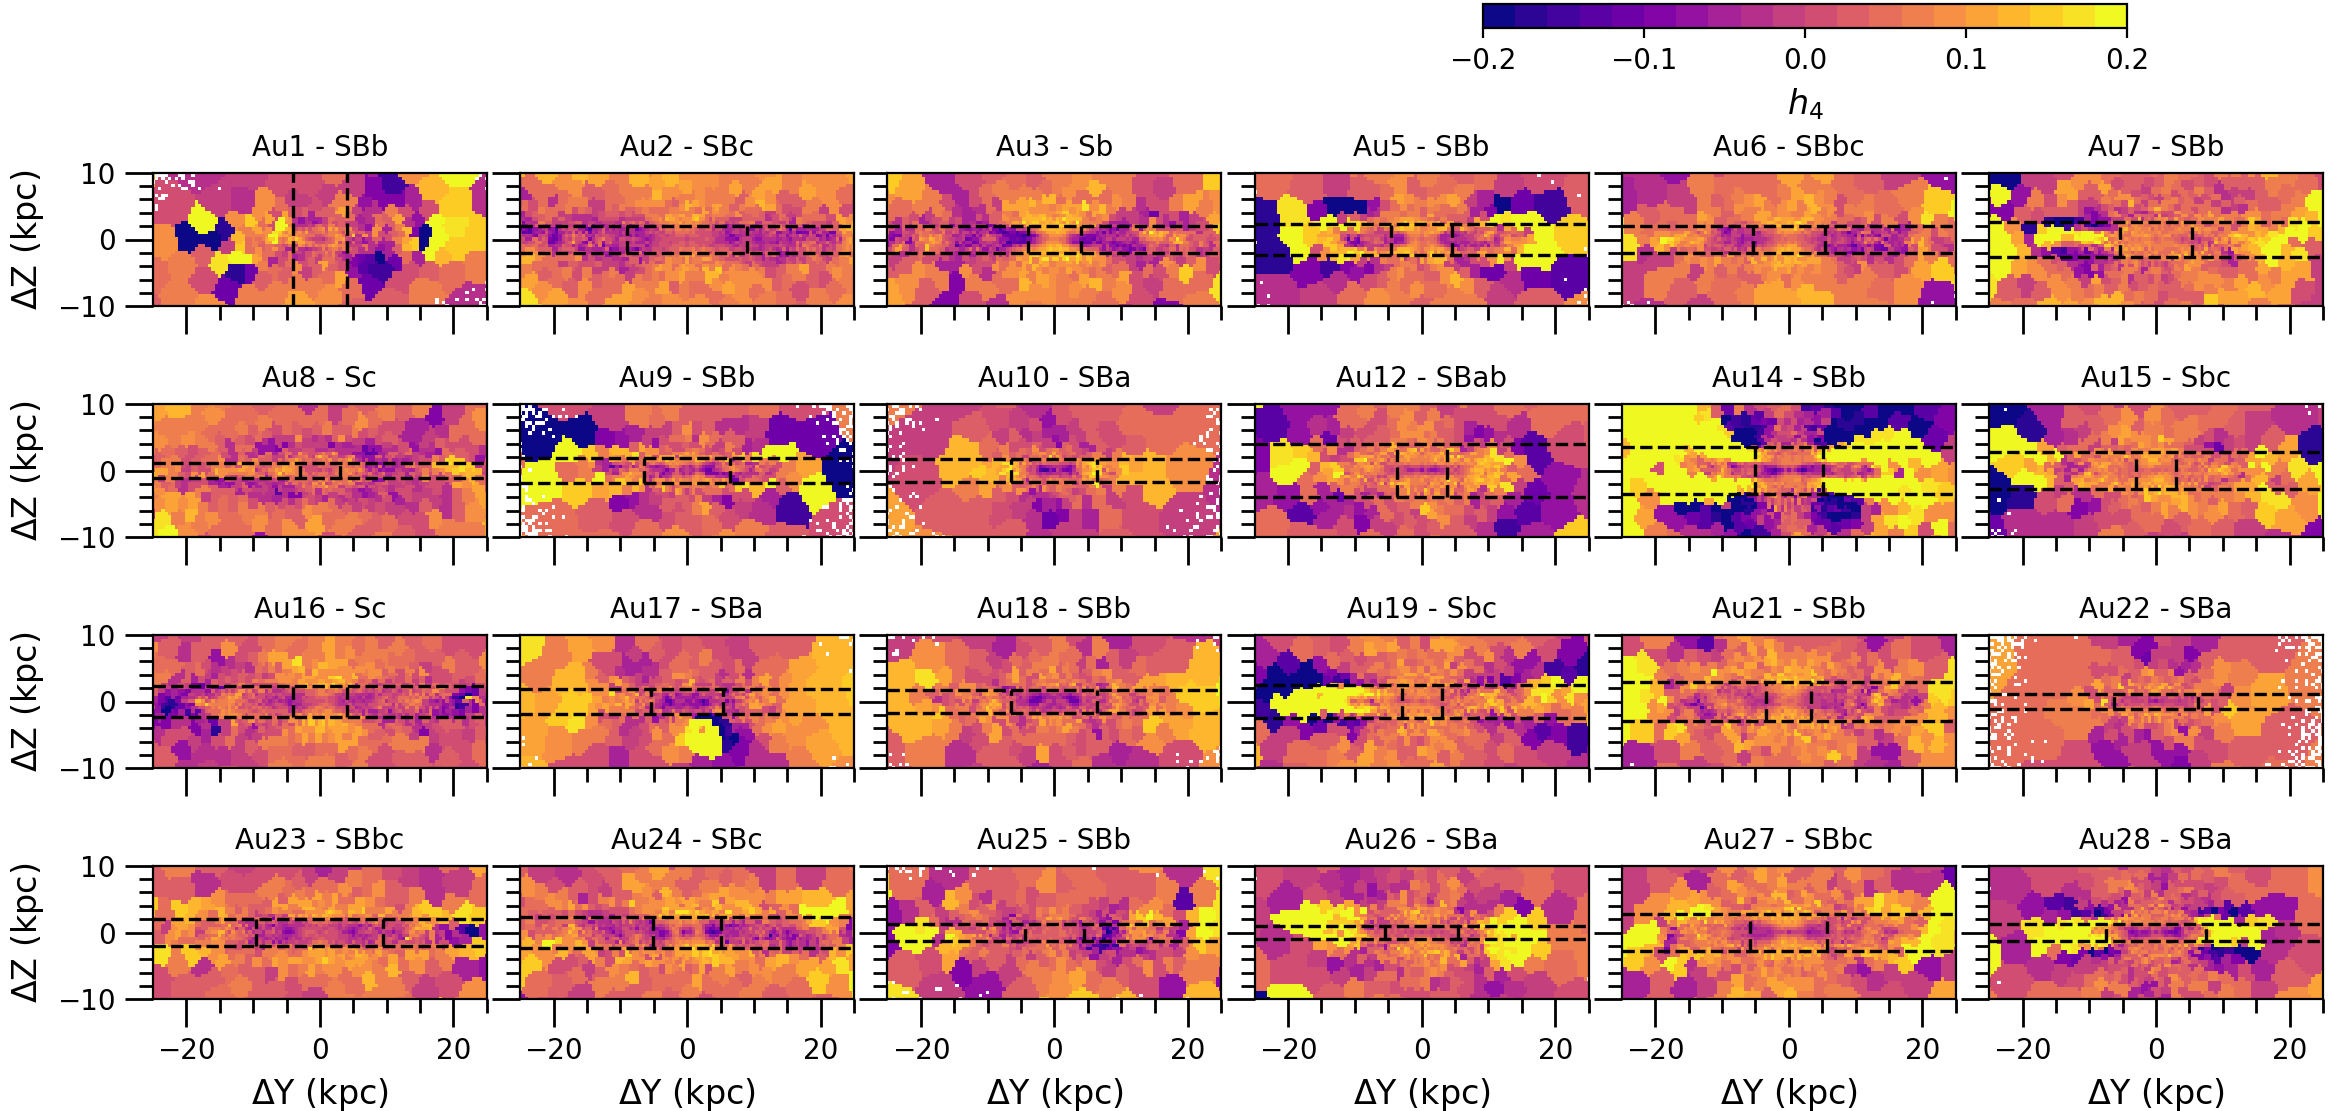
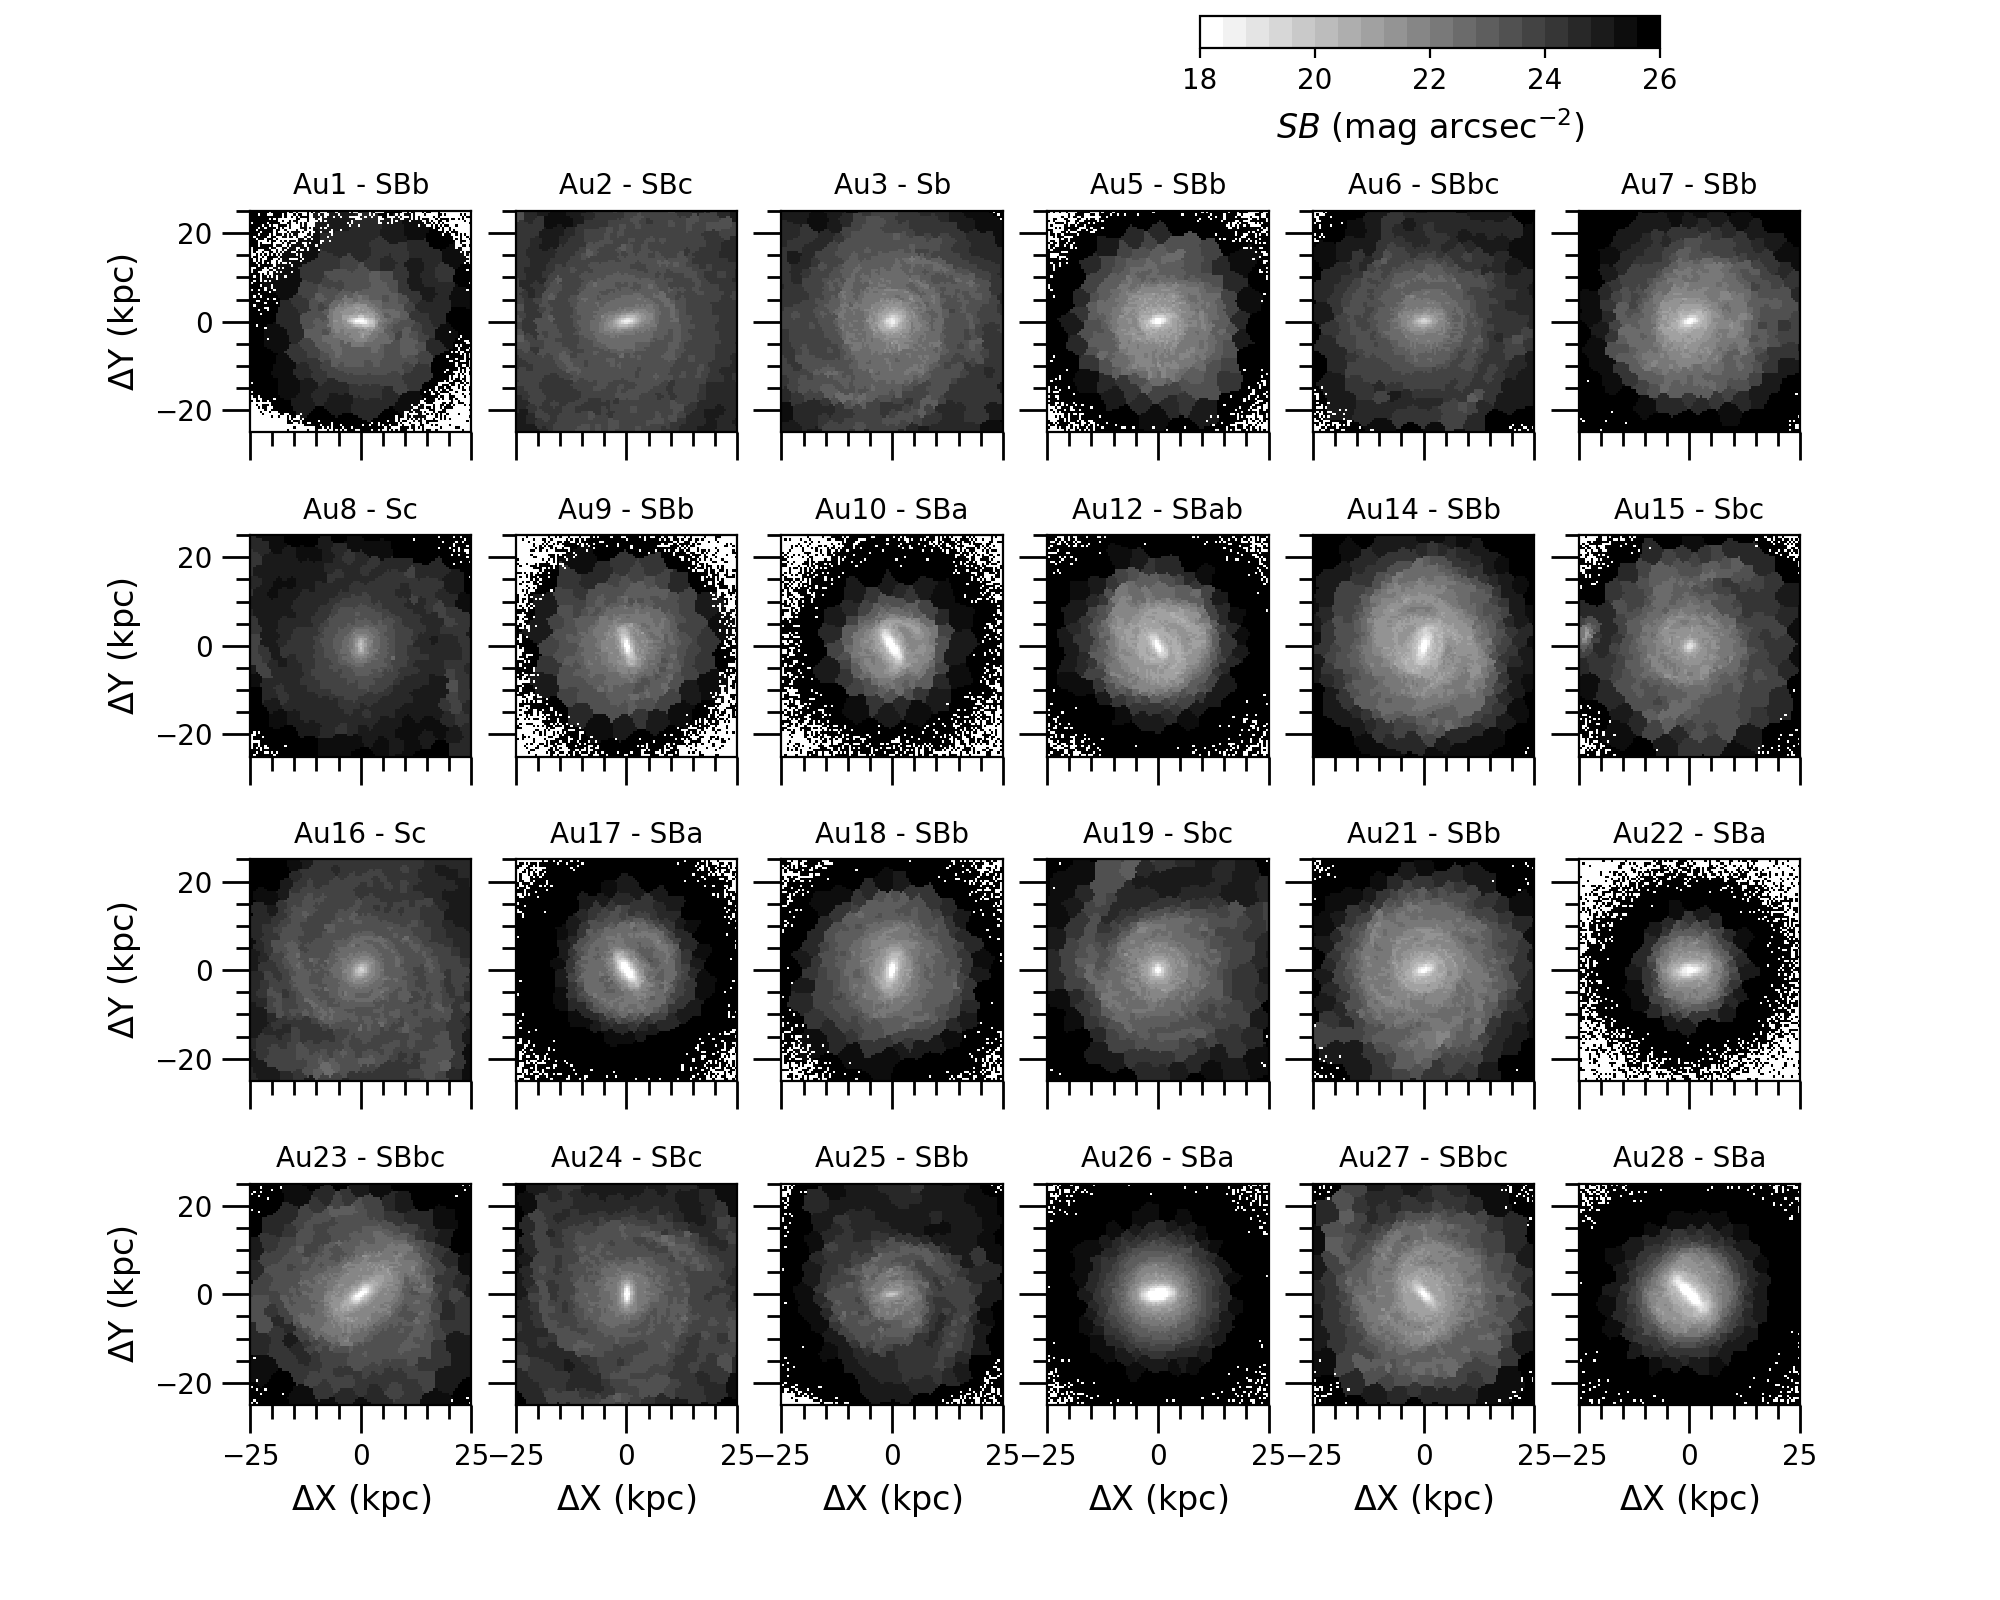
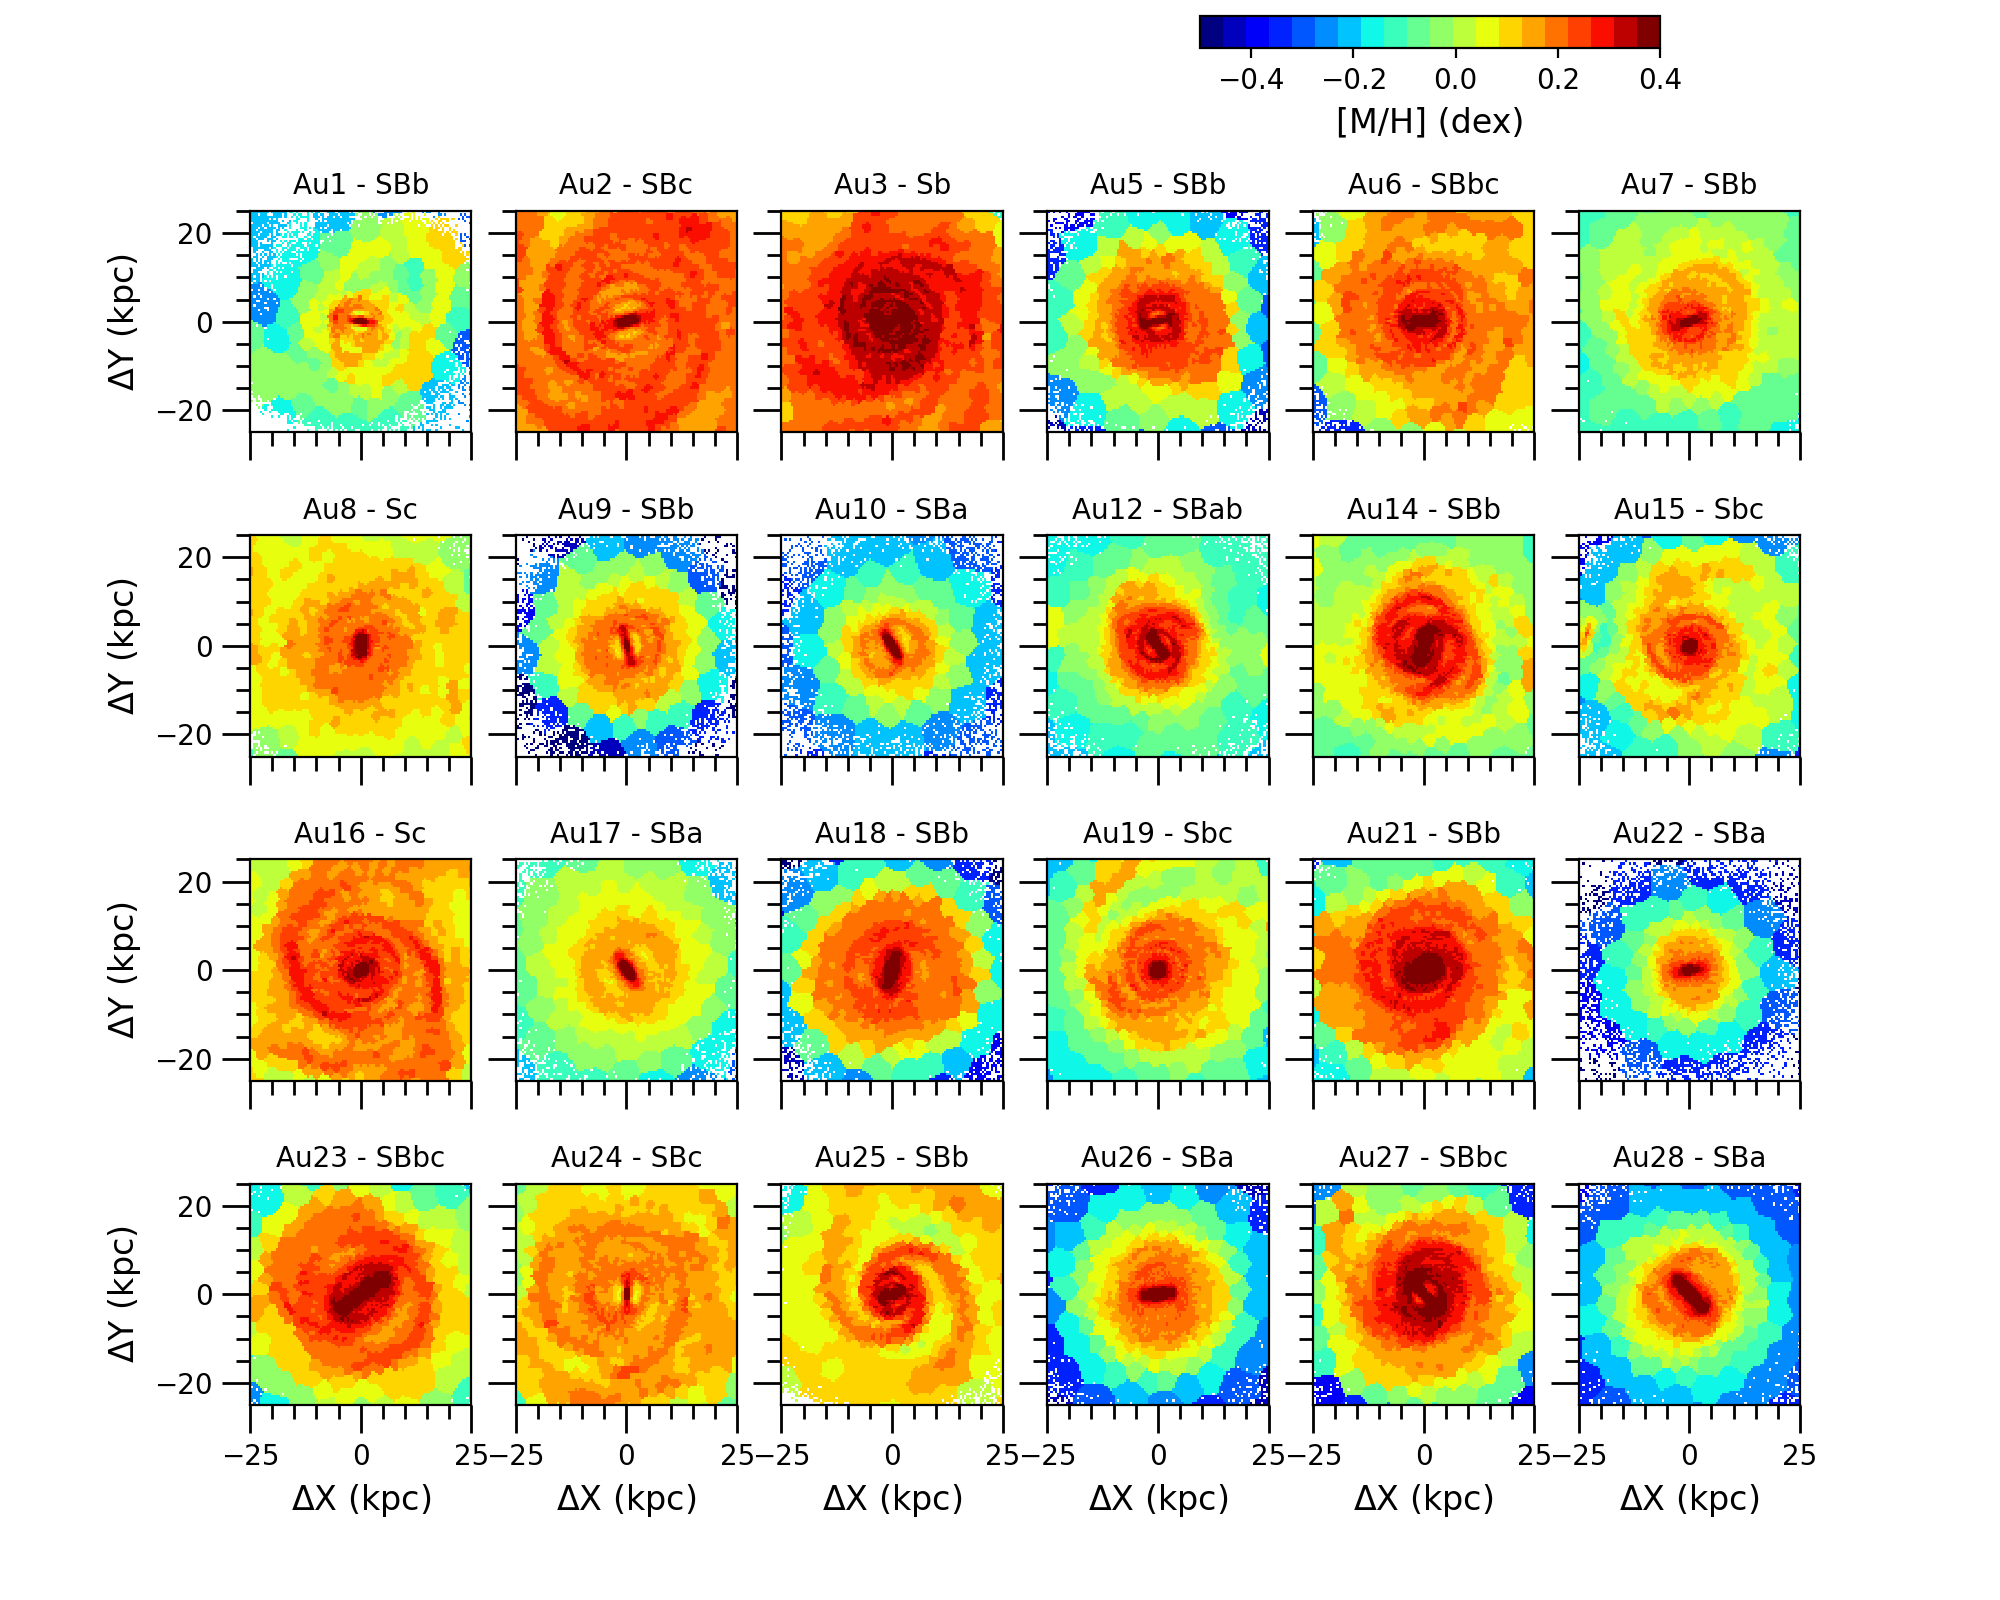
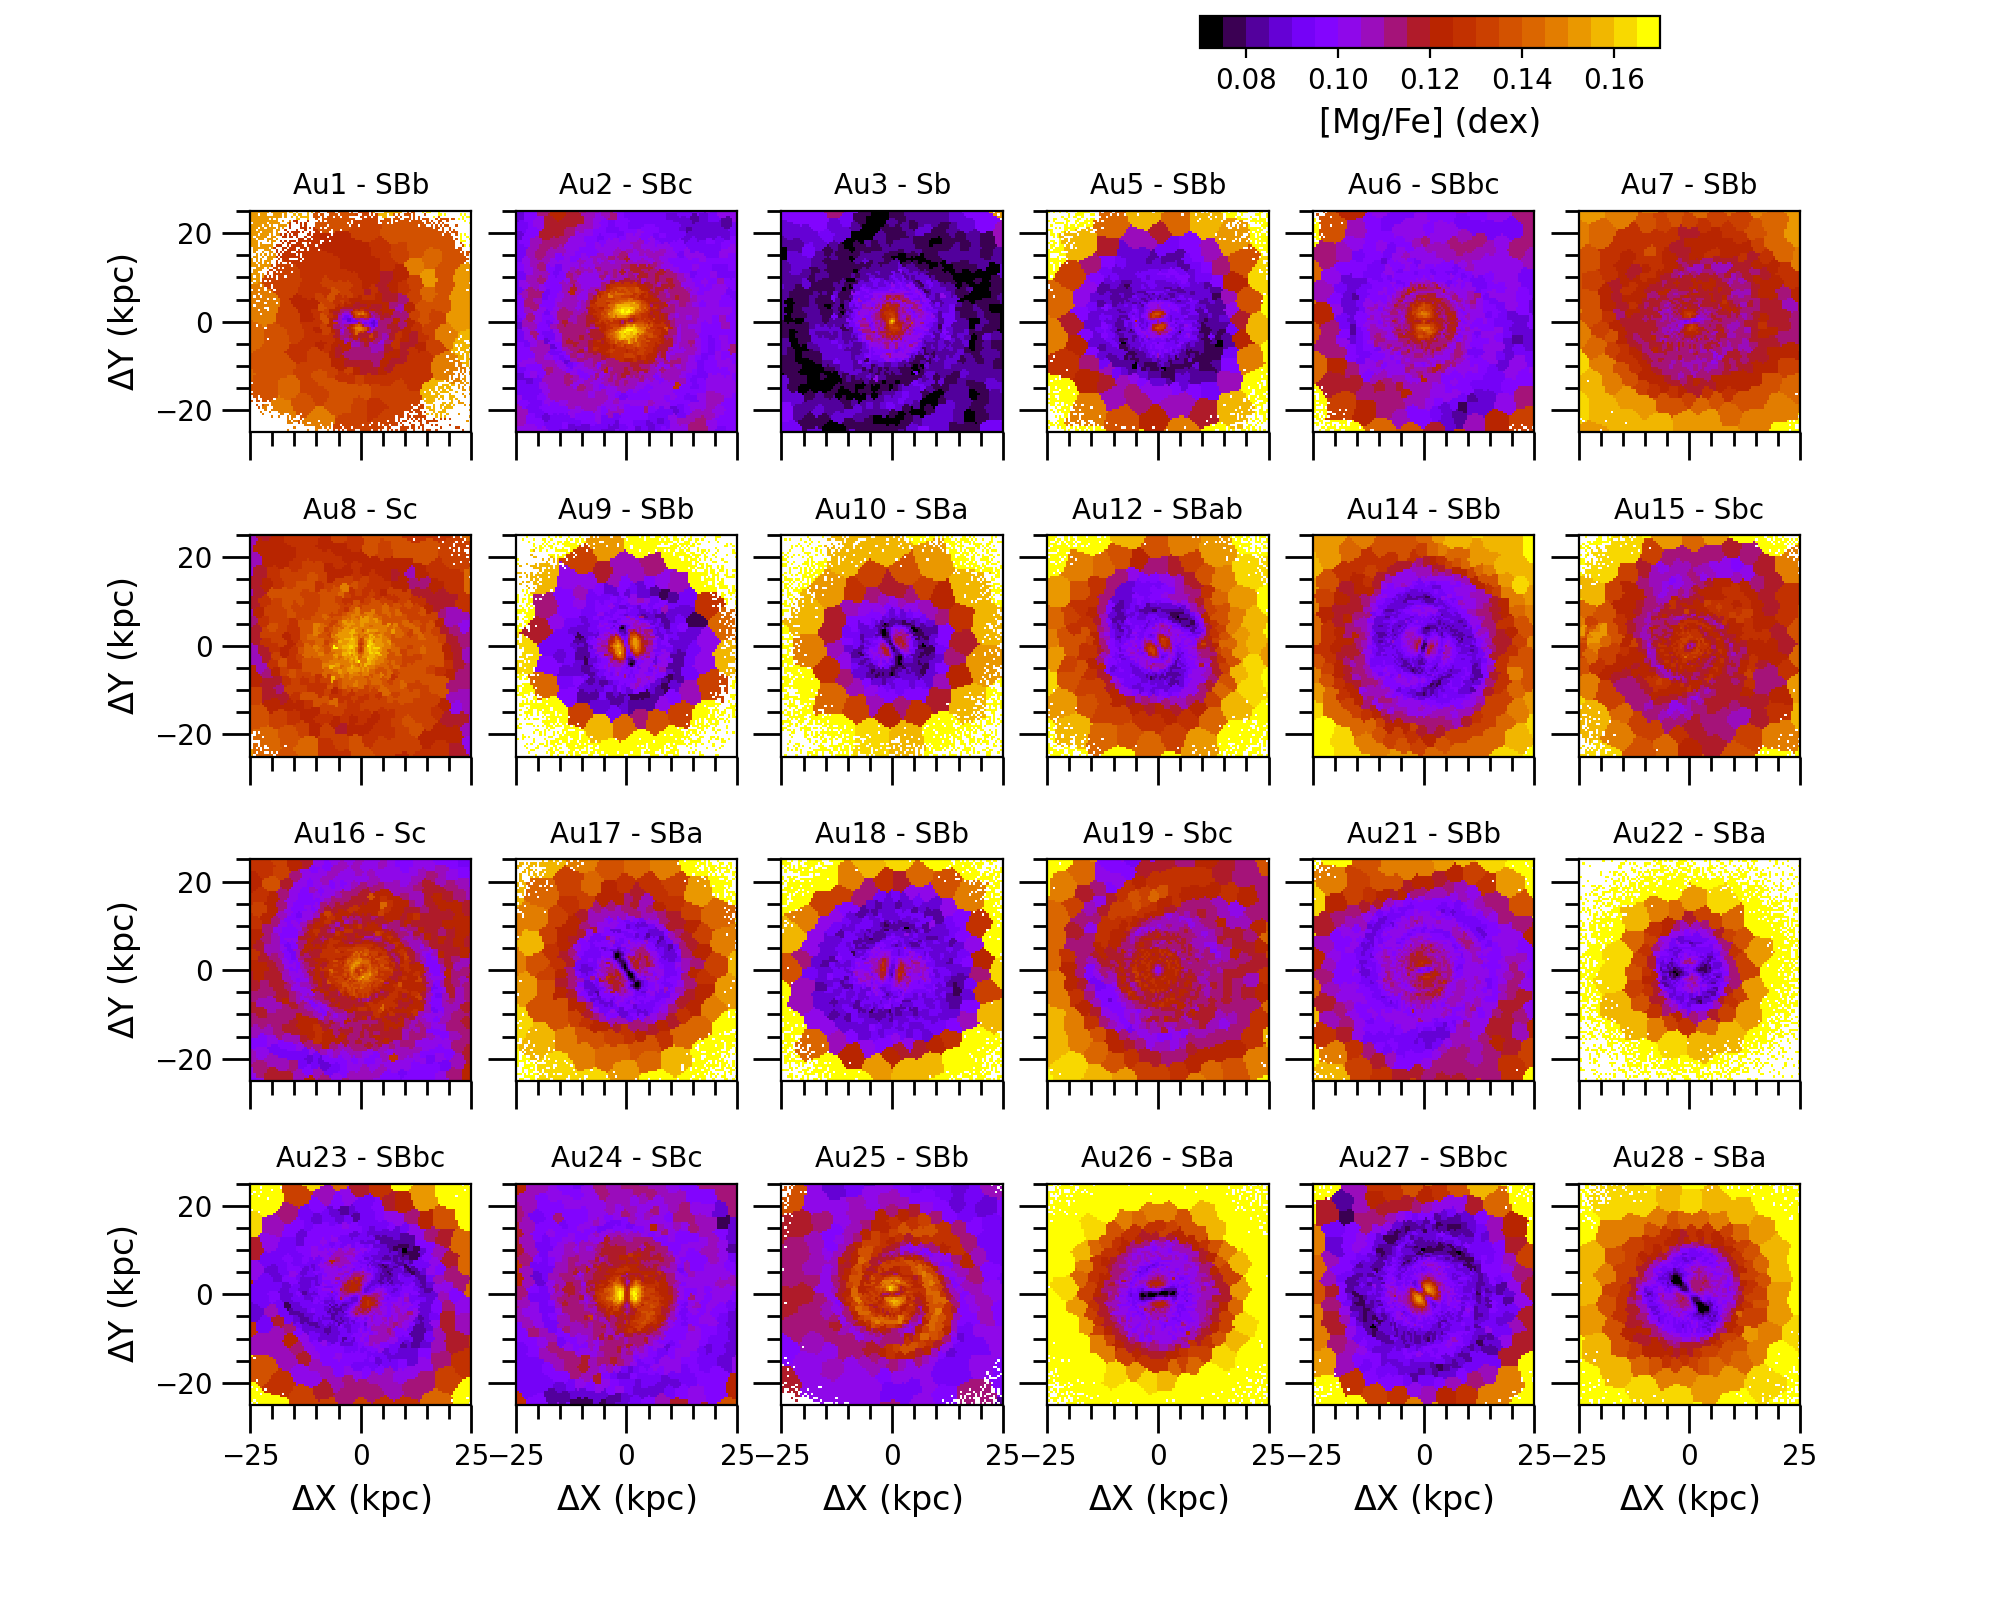
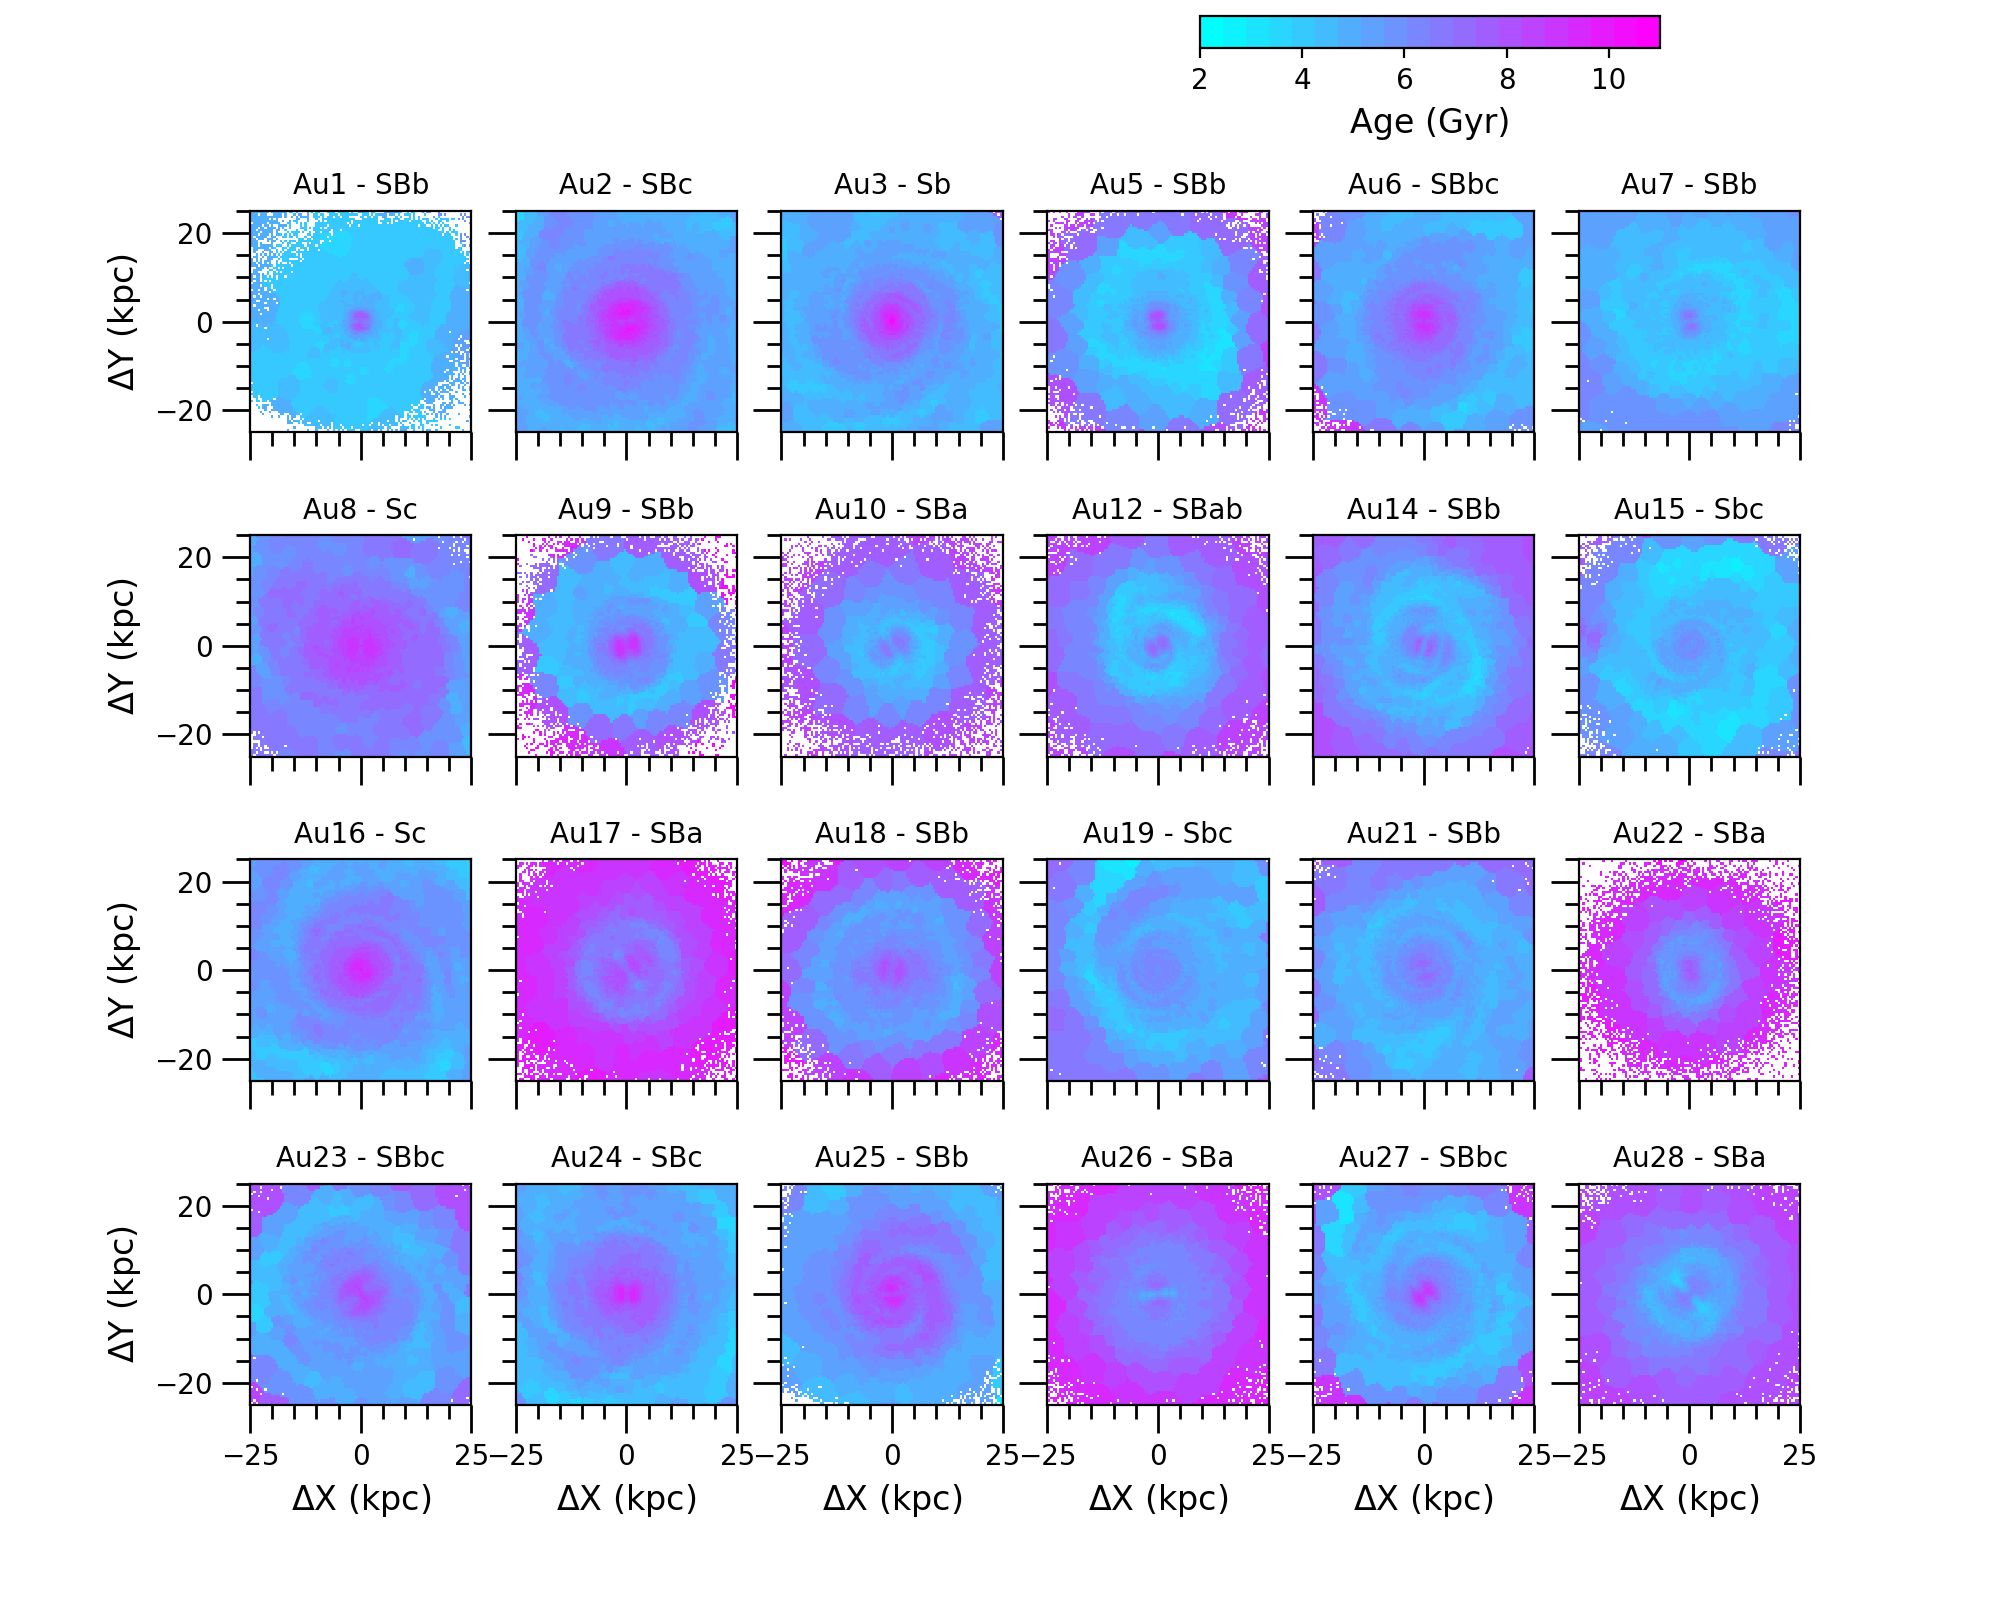
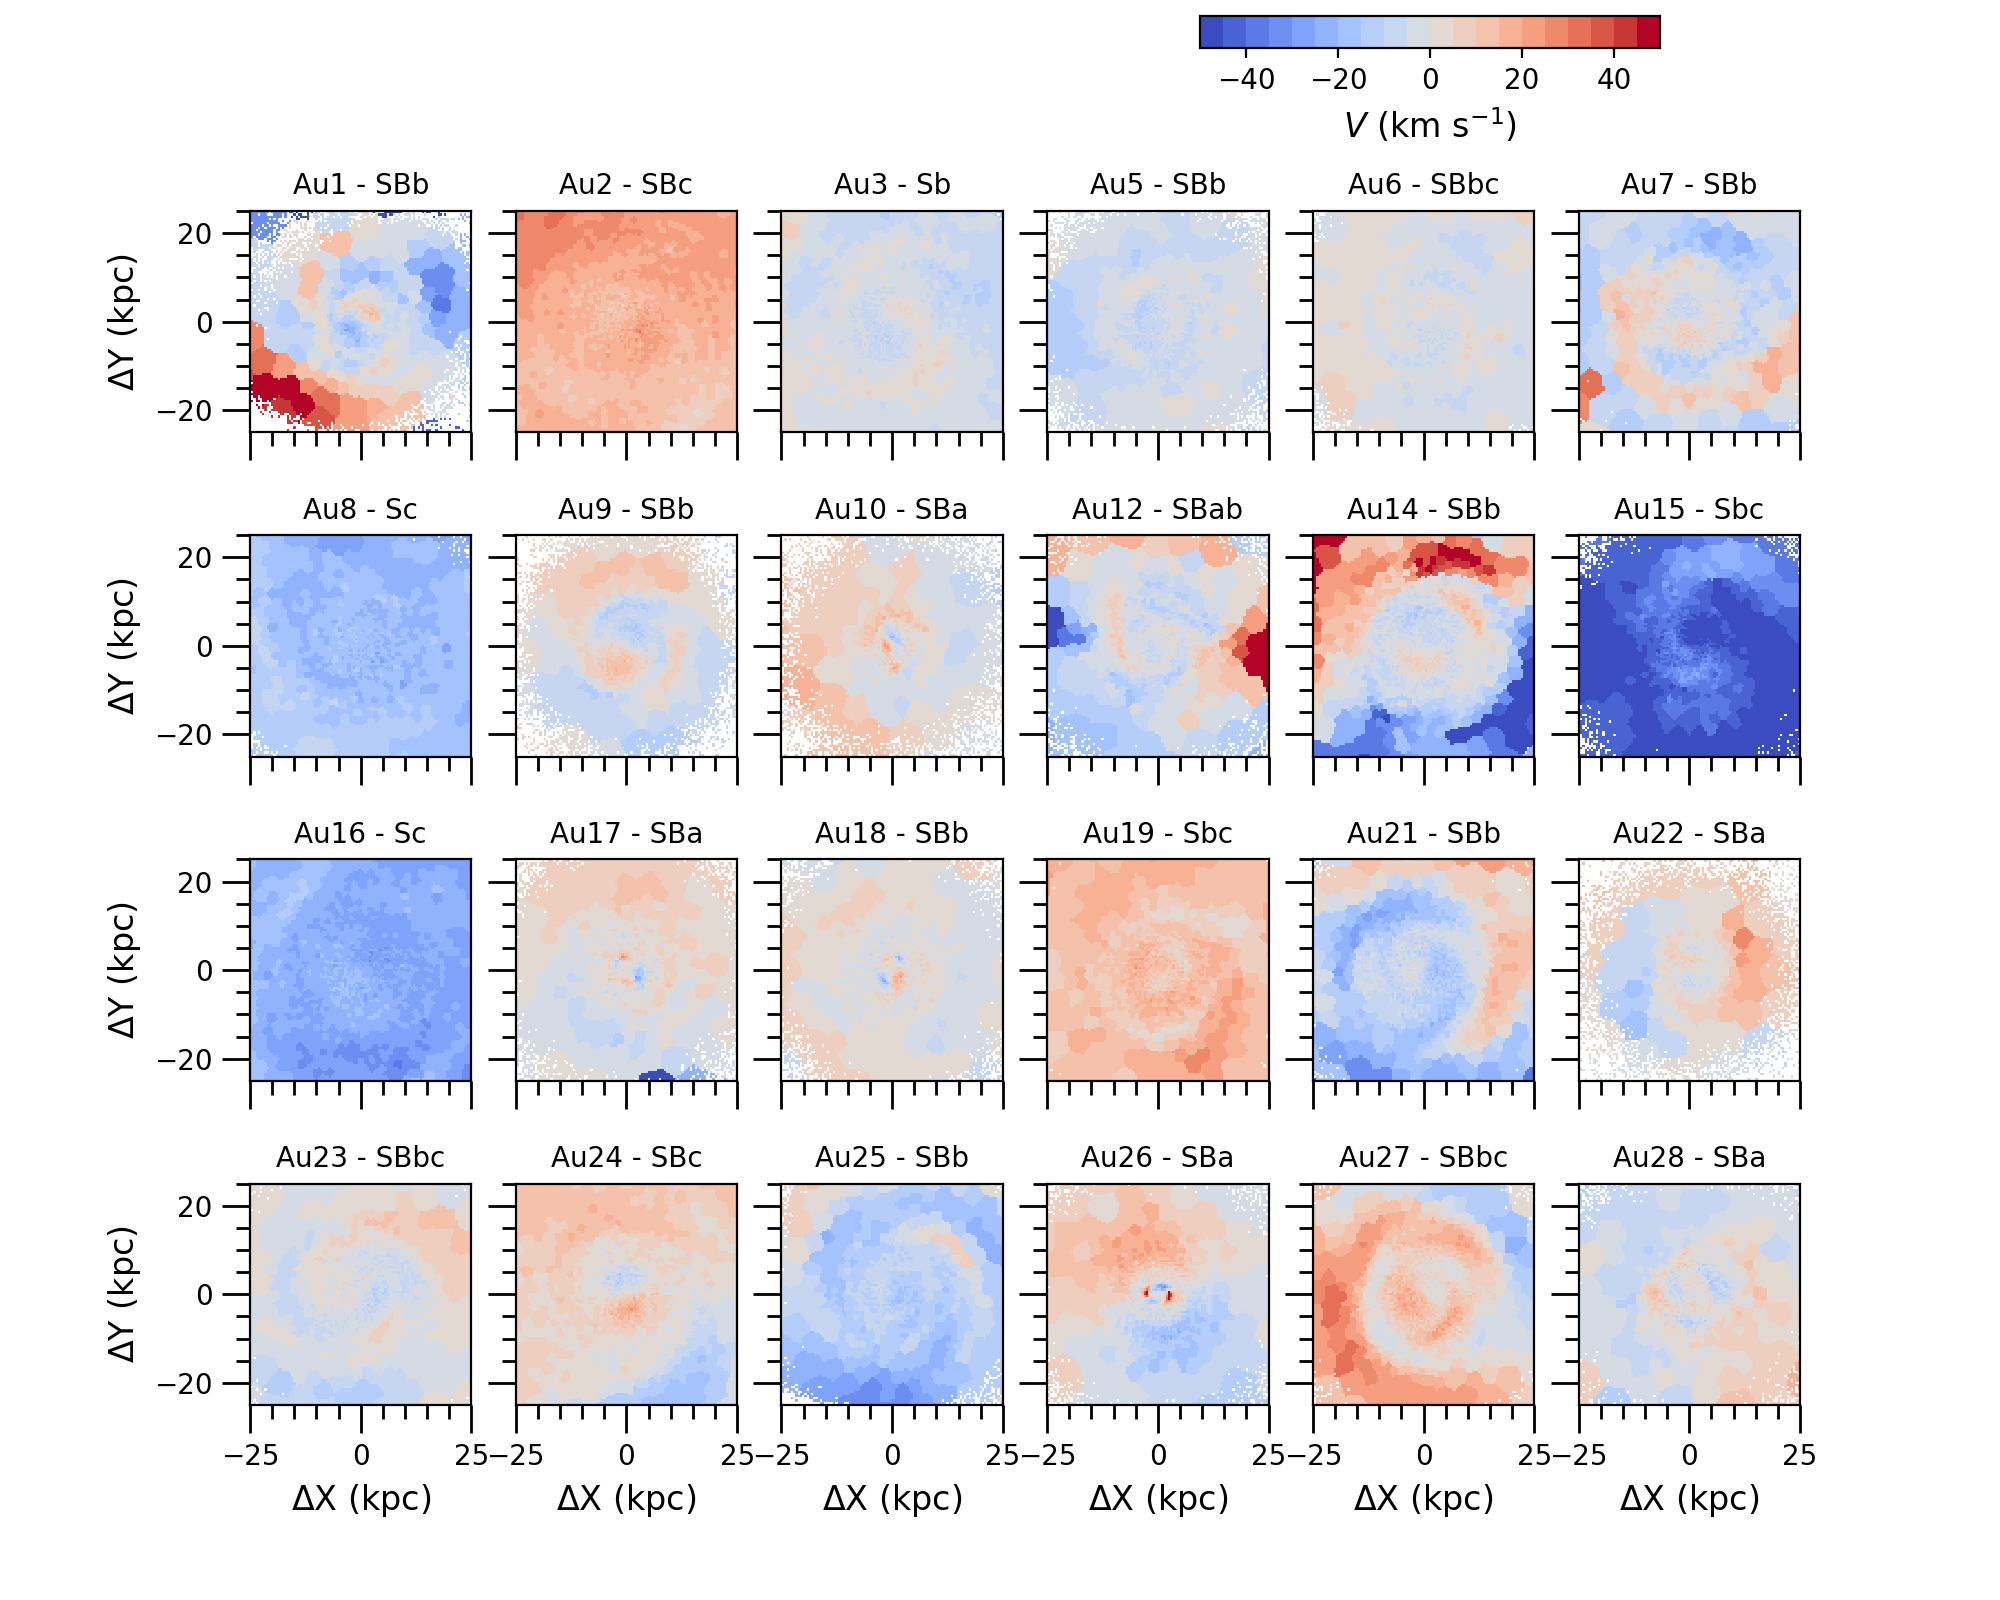
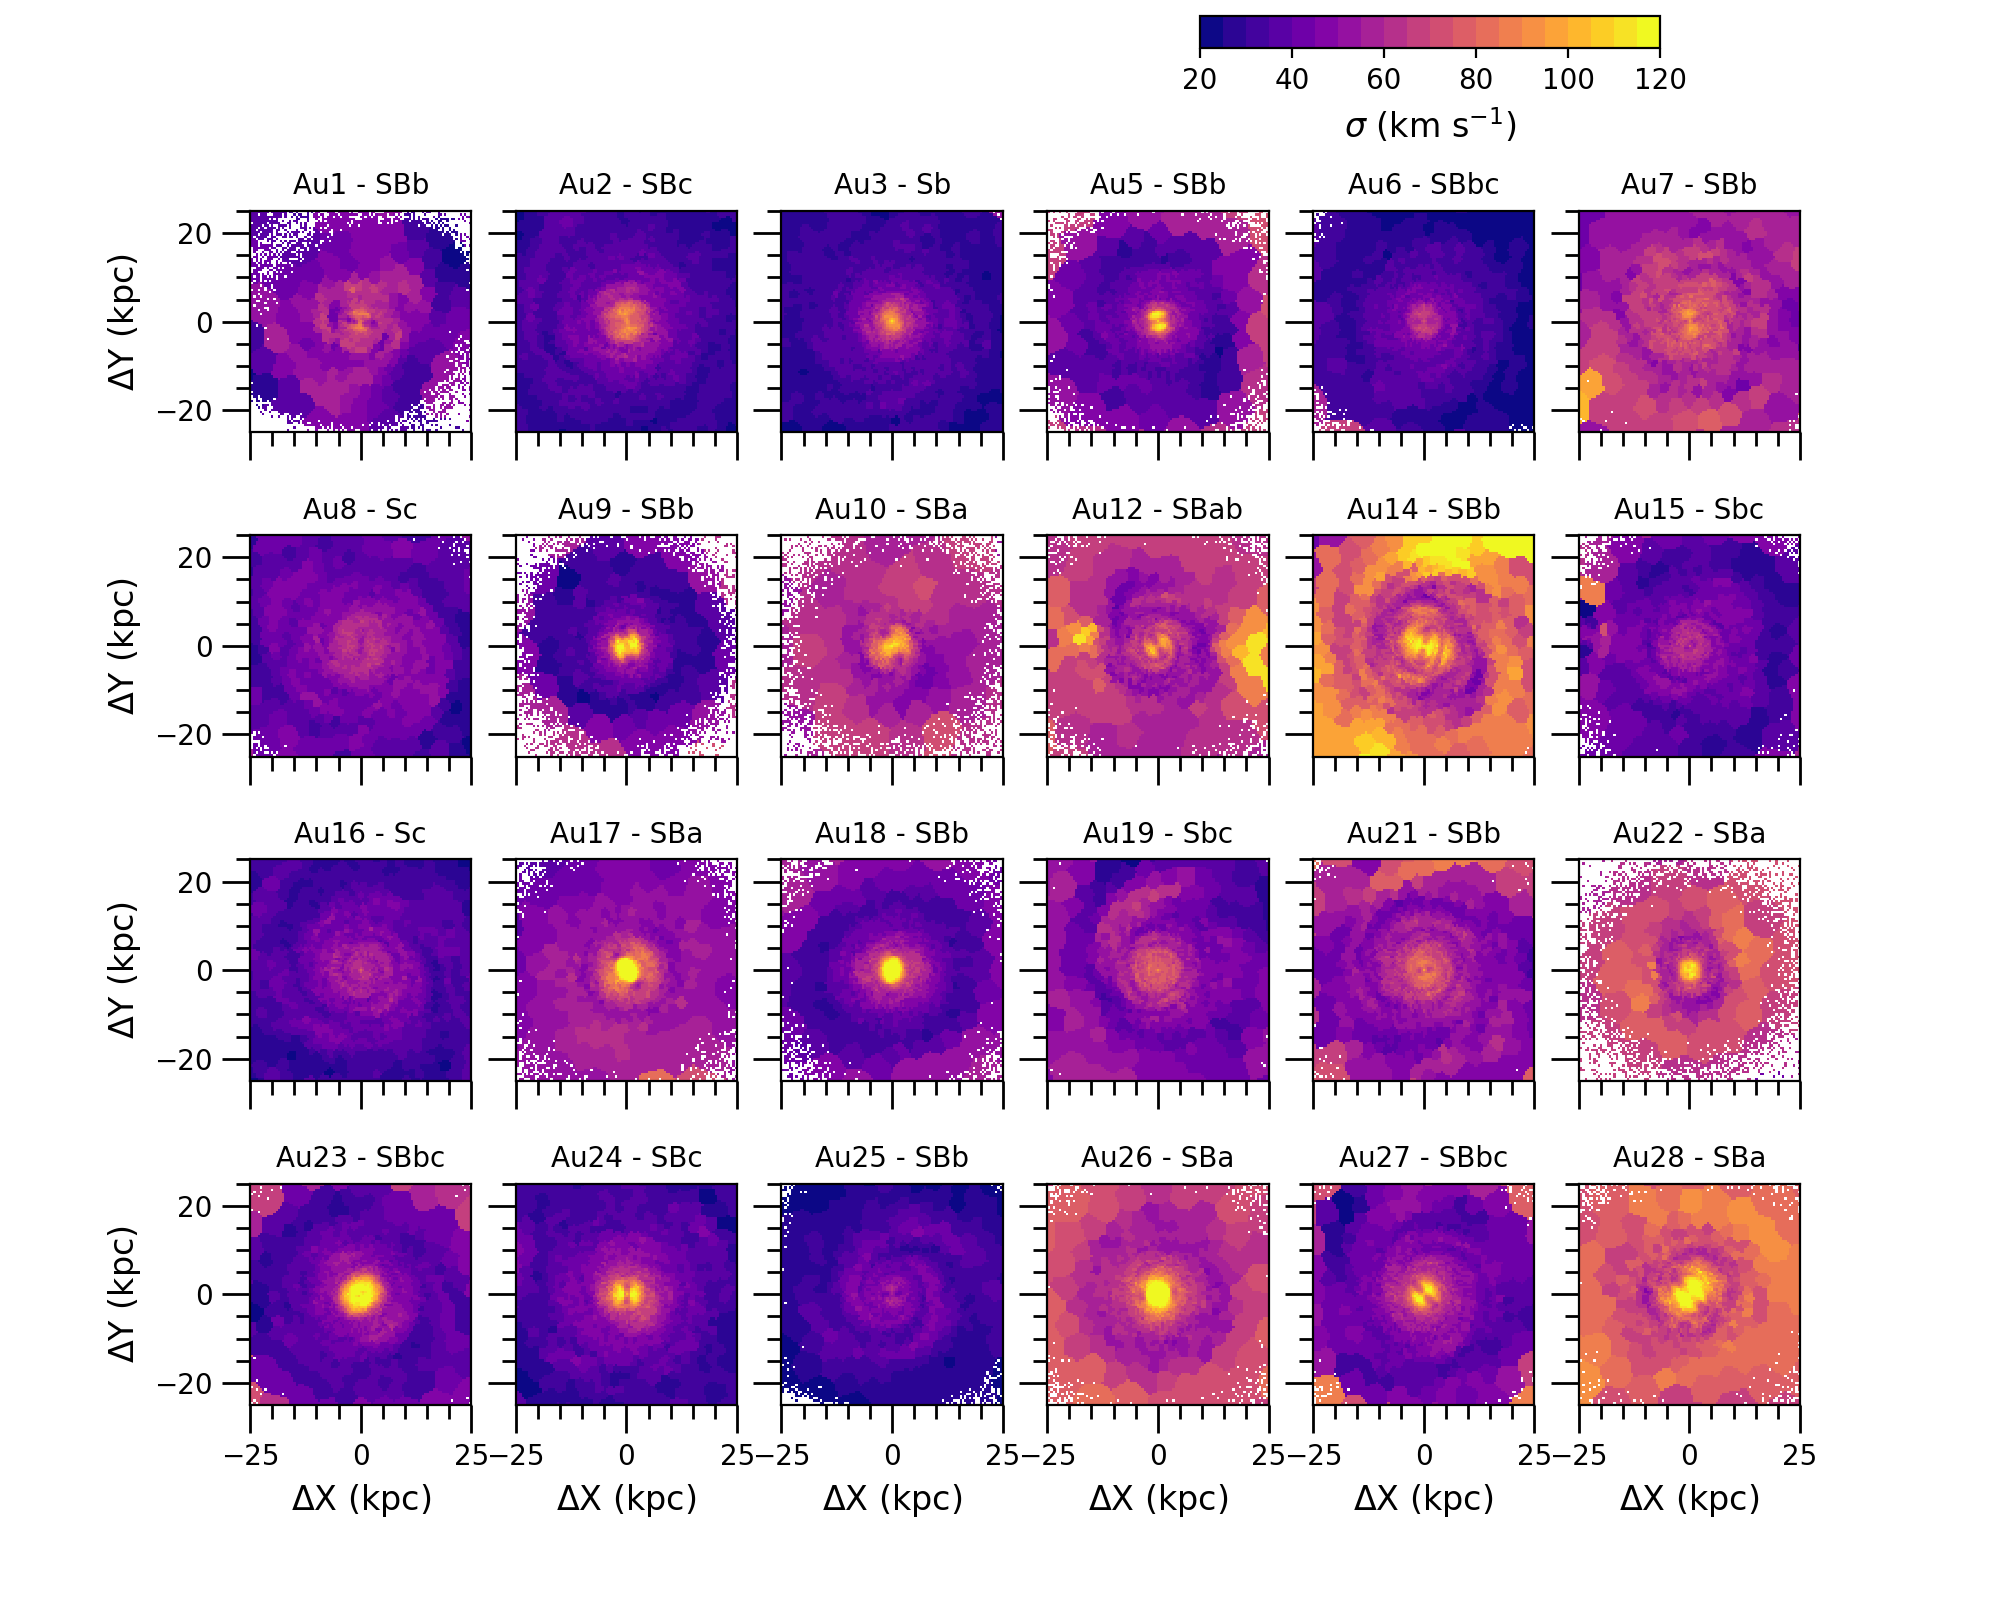
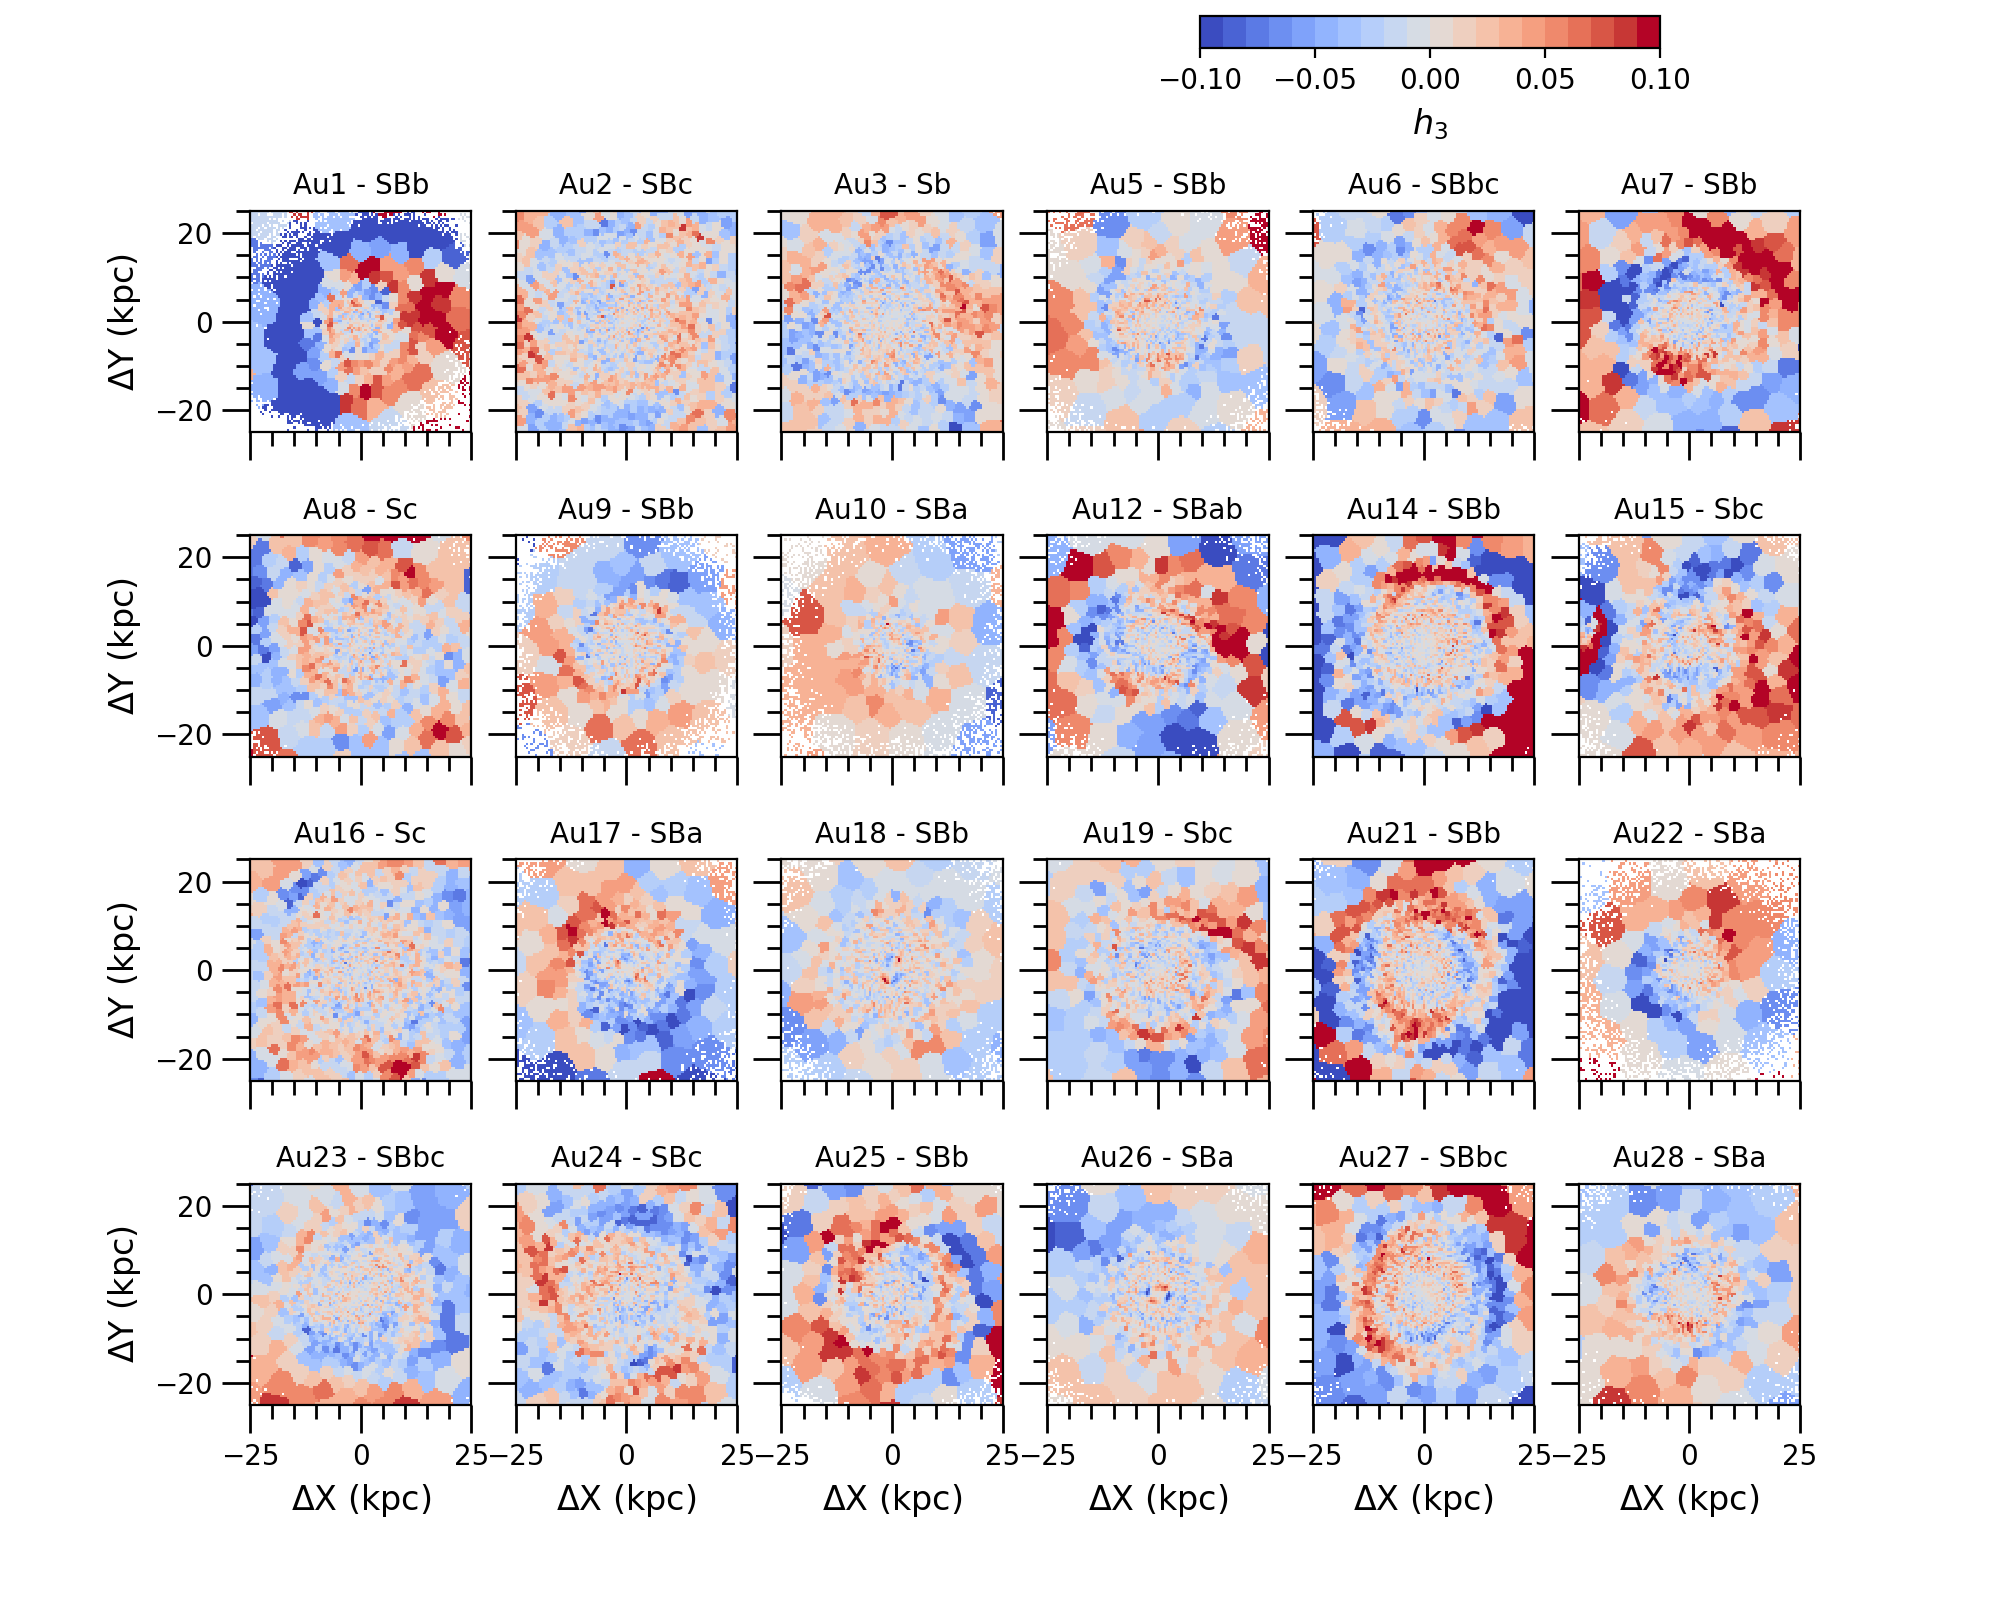
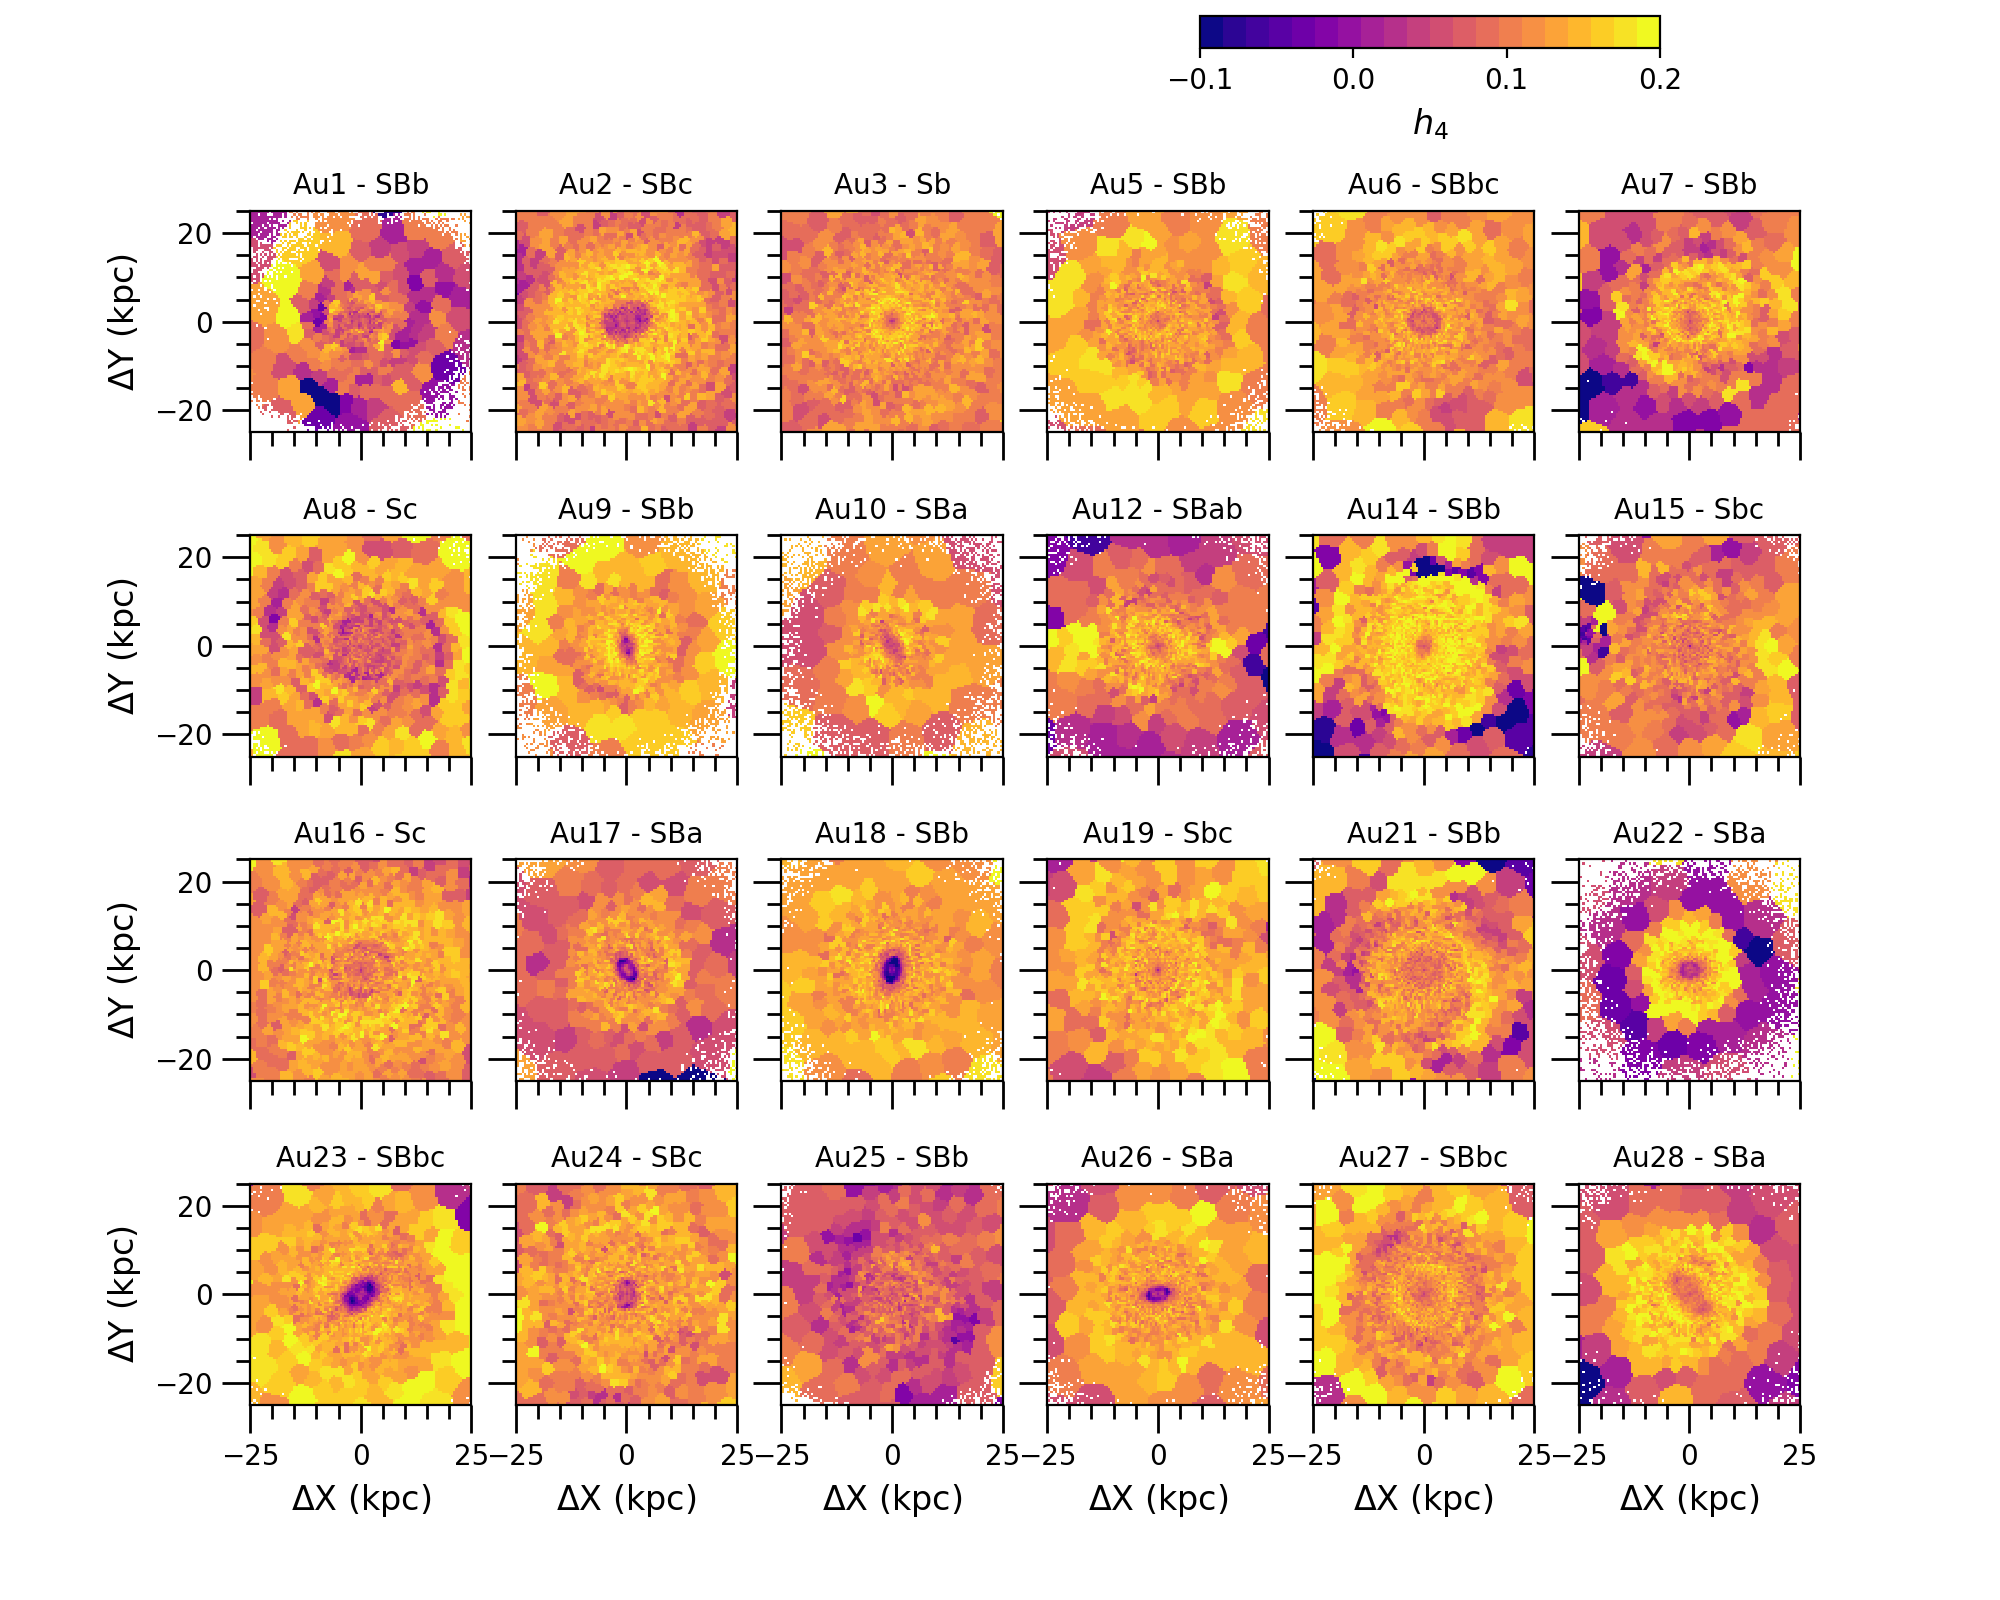
Mock Integral Field Spectroscopy maps (Pinna et al. 2024, A&A in press)
The series of images below show galactic maps of various stellar population and kinematic parameters for 24 Auriga simulations, from Pinna et al. 2024. Maps were produced as if they were viewed edge-on/face-on by an integral-field spectrograph. The two dashed horizontal lines demarcate where the thin and the thick disk dominate the light: the former between and the latter outside the two lines. The region between the two vertical dashed magenta lines is dominated by a central component (the bar in barred galaxies and a classical bulge in non-barred galaxies). The quantities are indicated in the color bar and underneath each image and the name of each halo and galaxy Hubble type (following the classification from Walo-Martín et al. 2021) are indicated on the top of each panel.