MPA-HOMEPAGE        


Simulations including gas  
 

MPA Homepage > Scientific Research > Research Groups > Galaxy Formation > VIRGO > Simulations including gas
 

Go to:

-Introduction
-Data
-References
-Credit

linkData Visualization (images & movies from Numerical Simulation projects)

link VIRGO Members
link VIRGO Links
external link Main U.K. Site
external link Public Announcement
of the VIRGO data
release

Introduction

This page include simulations of:


Data top

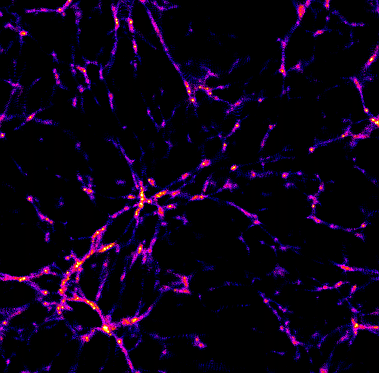
Simulations of InterGalacticMedium

Tom Theuns and his collaborators are studying the evolution of the Ly_alpha forests at high redshifts.

Pic.1 Gas density distribution in a volume of size 11x11x1.35 (h-1Mpc)3. High density regions are yellow, low density regions are black. The mass resolution is 1.5 x 10⁶ Msun. The gas has a characteristic filamentary appearance, with high density knots corresponding to forming galaxies at the intersection of two or more filaments.

larger format:
savegzipped ps (150 KB)
linkGIF format(120KB)


IGM z=3

Credit: Tom Theuns, ref.1


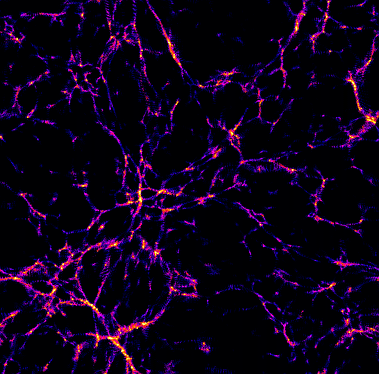
Pic.2 Same as Pic.1, z=5.0.

larger format:
savePS format(180KB)
linkGIF format(140KB)

IGM z=5

Credit: Tom Theuns, ref.1

Hydrodynamic simulation with radiative cooling top

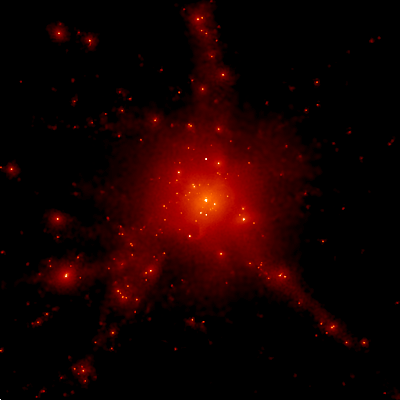
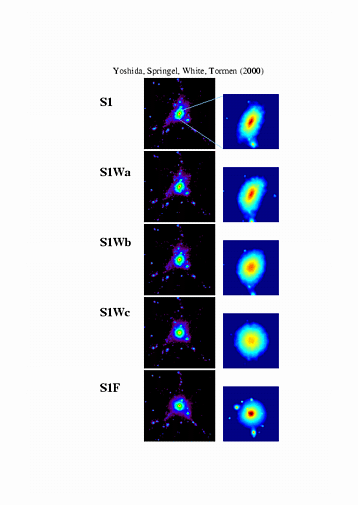
Yoshida et al. (2002, see the reference below) used two techniques for following gas cooling in simulations of galaxy formation, and compared the results such as `galaxy' (cold dense gas) masses and their positions.

Pic.1 Projected gas distribution in a box of 15 h-1Mpc

larger format:
savePS format(150KB)
linkGIF format(120KB)

Credit: See ref.2


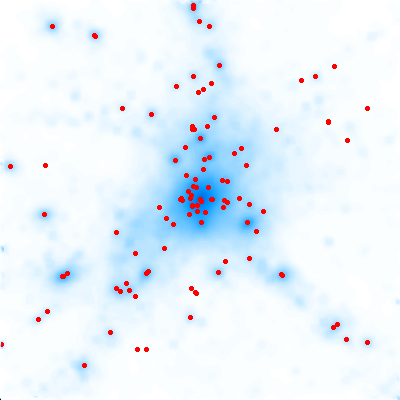
Pic.2 The distribution of the `galaxies' in the hydrodynamic and semianalytic simulations. The blue-white color scale shows the underlying matter distribution.

SPH simulation (left) and the semi-analytic model (right)

sph bothsam both

Credit: See ref.2


SPH/N-body Simulations of Clusters

Formation of a cluster size dark halo by collisional and collisionless dark matter


Pic.1 Projected mass distributions in a cube box 15 Mpc/h per oneside (left column) and in the central regions of 2 Mpc/h per one side (enlarged, right column). The picture clearly shows the difference (as well as similarlities in the outer region of the halo) in mass distribution, morphorlogy of the central part, and abundance of subclumps.

larger version savegzipped PS format

Credit: See ref. 3 - 4

Referencestop

  1. P3M-SPH simulations of the Ly-alpha forest
    T.Theuns, A.Leonard, J.Schaye, G.Efstathiou, F.Pearce, and P.Thomas
    1998, MNRAS, 301, 478
  2. Gas cooling in simulations of the formation of the galaxy population
    N. Yoshida, F. Stoehr, V. Springel, and S.D.M. White
    2002, astro-ph/0202341
  3. Collisional dark matter and the structure of dark halos
    N.Yoshida, V.Springel, S.D.M.White, G.Tormen
    2000, ApJ, 535, L103 (preprint astro-ph/0002362)
  4. Weakly self-interacting dark matter and the structure of dark halos
    N.Yoshida, V.Springel, S.D.M.White, G.Tormen
    2000, ApJ, 544, L87 (preprint astro-ph/0006134)

Credittop

Here is an example of proper credit for these Virgo data.
"The simulations in this paper were carried out by the Virgo Supercomputing Consortium using computers based at Computing Centre of the Max-Planck Society in Garching and at the Edinburgh Parallel Computing Centre. The data are publicly available at www.mpa-garching.mpg.de/galform/virgo/sim_gas/index.shtml"

Comments to: Virgo Administrator virgo@mpa-garching.mpg.detop