|
Introduction
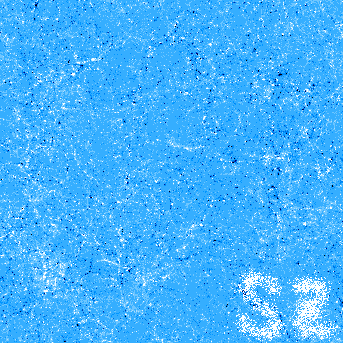
Image 1: Simulated kinetic SZ map (created by Naoki Yoshida and
Antonaldo Diaferio)
This picture is created by projecting our simulation box [see  Very
Large Simulations] (480Mpc/h on a side) in one direction on a 2400
x 2400 grid. We assume that baryons trace the dark matter, i.e. baryon
densities and peculiar velocities are proportional to those of the dark
matter. The colours show the CMB temperature fluctuationss with white
denoting approaching material and black receding material. Clusters and
superclusters in formation are clearly visible. Very
Large Simulations] (480Mpc/h on a side) in one direction on a 2400
x 2400 grid. We assume that baryons trace the dark matter, i.e. baryon
densities and peculiar velocities are proportional to those of the dark
matter. The colours show the CMB temperature fluctuationss with white
denoting approaching material and black receding material. Clusters and
superclusters in formation are clearly visible.

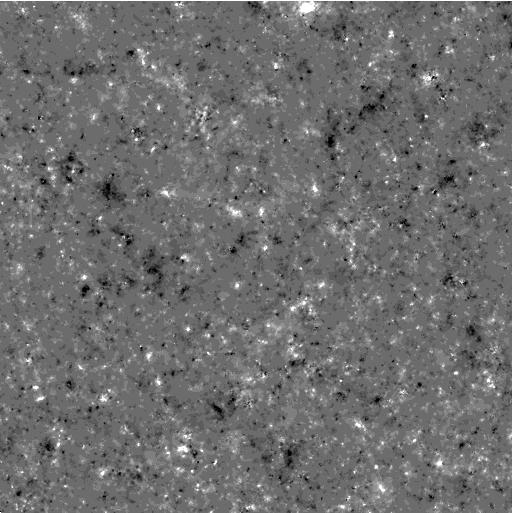
Image 2: Stacked kinetic SZ map, 3.4 x 3.4 degree2
field
To make a realistic sky map, we stack simulation boxes in
a line extending to high redshift. The simulation [see  Higher
Resolution Simulations in Smaller Boxes] outputs at 14 different redshifts
between 0 and 10 are arranged such that they fit together and fill in
the volume of a past lightcone of the observer. We select an area of one
degree on a side. The map is made with 2048 x 2048 pixels, corresponding
to an angular resolution of 0.1 arcminute. Fractional temperature variations
delta T/T is shown in a linearly scaled grey color. Higher
Resolution Simulations in Smaller Boxes] outputs at 14 different redshifts
between 0 and 10 are arranged such that they fit together and fill in
the volume of a past lightcone of the observer. We select an area of one
degree on a side. The map is made with 2048 x 2048 pixels, corresponding
to an angular resolution of 0.1 arcminute. Fractional temperature variations
delta T/T is shown in a linearly scaled grey color.

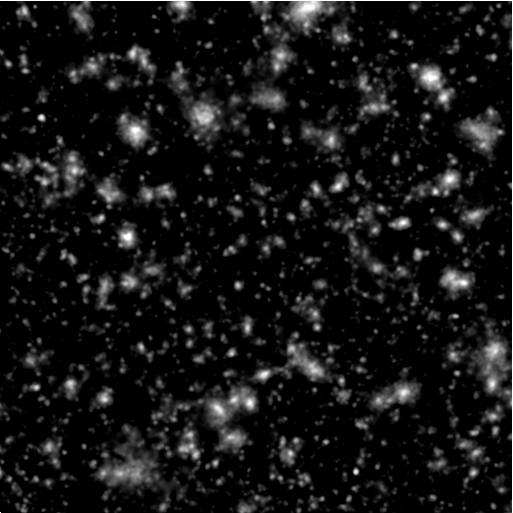
Image 3: Stacked thermal SZ map
As for Image 2, but for the thermal effect. The grey scale
is logarithmic for this picture.

Simulation parameters
Please see  Very
Large Simulations. Very
Large Simulations.
References
Superclusters with Thermal SZ effect surveys
A. Diaferio, A. Nusser, N. Yoshida, R. A. Sunyaev, 2003, MNRAS, 338, 433
Non-Gaussian CMB Temperature Fluctuations from Peculiar Velocities
of Clusters
N. Yoshida, R. Sheth, and A. Diaferio, 2001, MNRAS, 328, 669
Large-Scale Motions in Superclusters: their imprint in the cosmic
microwave background
A. Diaferio, R. A. Sunyaev, A. Nusser, 2000, ApJ, 533, L71
Credit
Here is an example of proper credit for these Virgo data.
"The simulations in this paper were carried out by the Virgo Supercomputing
Consortium using computers based at Computing Centre of the Max-Planck
Society in Garching and at the Edinburgh Parallel Computing Centre. The
data are publicly available at www.mpa-garching.mpg.de/galform/virgo/vls/resim.shtml"
Comments to: N. Yoshida  naoki@mpa-garching.mpg.de naoki@mpa-garching.mpg.de
|


