Stockinger, G., Janka, H.-Th., Kresse, D., Melson, T., Ertl, T., Gabler, M., Gessner, A., Wongwathanarat, A., Tolstov, A., Leung, S.-C., Nomoto, K., & Heger, A. (2020), MNRAS 496, 2039 (2020), ADS, arXiv eprint 2005.02420.
We provide the progenitor data of the three models under consideration (e8.8, z9.6, s9.0), stored in the HDF5 format (https://www.hdfgroup.org/solutions/hdf5/) and also as plaintext ASCII files. The files contain the radial grid (cell inner radius, cell center radius, cell outer radius), enclosed mass, density, temperature, pressure, specific internal plus kinetic energy, specific entropy per baryon, radial velocity, angular velocity, mass fractions of nuclear species, mean mass number of nuclei, and electron fraction. See README for more details on the file format. The original progenitor data of the e8.8, z9.6, and s9.0 models are from: Tolstov, Leung, & Nomoto (private communication); Heger (private communication); and Woosley & Heger (2015).
 e8.8_progenitor.h5
(plaintext format:
e8.8_progenitor.txt)
z9.6_progenitor.h5
(plaintext format:
z9.6_progenitor.txt)
s9.0_progenitor.h5
(plaintext format:
s9.0_progenitor.txt)
e8.8_progenitor.h5
(plaintext format:
e8.8_progenitor.txt)
z9.6_progenitor.h5
(plaintext format:
z9.6_progenitor.txt)
s9.0_progenitor.h5
(plaintext format:
s9.0_progenitor.txt)
Here, we provide the 3D-Yin-Yang hydrodynamical data of the three models under consideration (e8.8, z9.6, s9.0), each at three different times: briefly before the fastest part of the shock reaches the stellar surface, briefly after the shock breakout from the stellar surface is completed, and at the end of the simulation. The files contain the radial, theta, and phi grids, Yin-Yang surface weights, enclosed mass, density, specific internal and kinetic energies, pressure, specific entropy, temperature, velocities in radial, theta, and phi directions, mass fractions of nuclear species, and electron fraction. The data are stored in the HDF5 format (https://www.hdfgroup.org/solutions/hdf5/) and zipped as tarballs ("<MODEL>_3DYY_<TIME>.h5.tar.gz"). See README for more details on the file format.
We further provide the total yields of all considered nuclear species, tabulated in plaintext ASCII files ("<MODEL>_yields_<TIME>.txt"). Minor differences compared to the values listed in Table 5 of Stockinger et al. (2020) are caused by a slightly refined re-analysis of the simulation data. Moreover, the original progenitor composition of s9.0 (containing 54Fe instead of 52Fe and 56Ni) was restored (see note below).
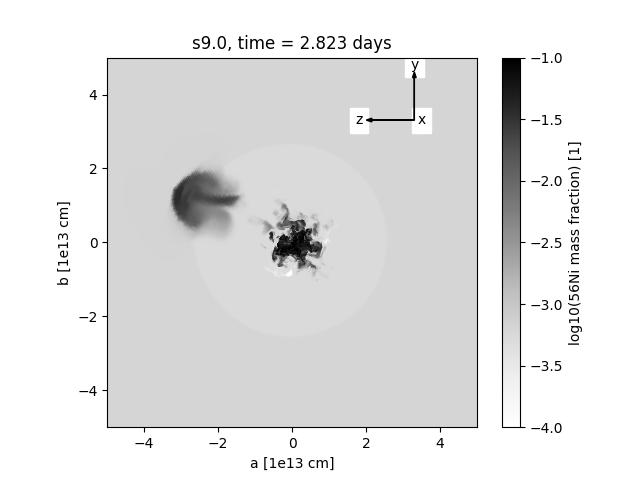
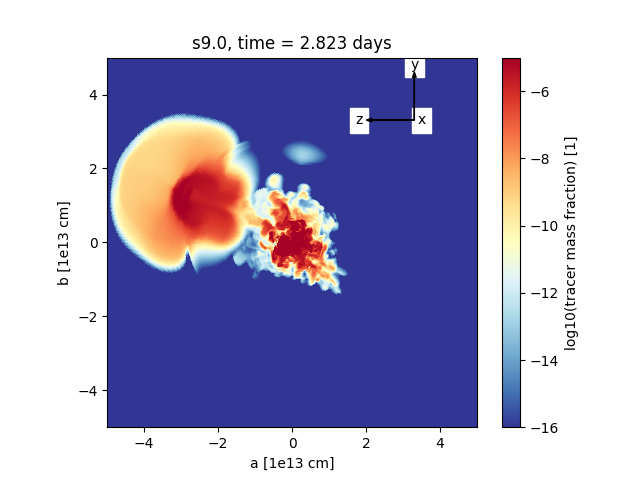
e8.8_3DYY_004.792d.h5.tar.gz (yields: e8.8_yields_004.792d.txt) → ~0.2 days before shock breakout e8.8_3DYY_005.208d.h5.tar.gz (yields: e8.8_yields_005.208d.txt) → ~0.2 days after shock breakout e8.8_3DYY_115.742d.h5.tar.gz (yields: e8.8_yields_115.742d.txt) → at the end of the simulation z9.6_3DYY_001.153d.h5.tar.gz (yields: z9.6_yields_001.153d.txt) → ~0.1 days before shock breakout z9.6_3DYY_001.389d.h5.tar.gz (yields: z9.6_yields_001.389d.txt) → ~0.1 days after shock breakout z9.6_3DYY_104.200d.h5.tar.gz (yields: z9.6_yields_104.200d.txt) → at the end of the simulation s9.0_3DYY_001.974d.h5.tar.gz (yields: s9.0_yields_001.974d.txt) → ~0.2 days before shock breakout s9.0_3DYY_003.278d.h5.tar.gz (yields: s9.0_yields_003.278d.txt) → ~0.2 days after shock breakout s9.0_3DYY_019.738d.h5.tar.gz (yields: s9.0_yields_019.738d.txt) → at the end of the simulationNote: In case of the s9.0 model the 54Fe nuclei from the progenitor model had been mapped into 52Fe and 56Ni (each 50%) for the late phases of the evolution because 54Fe is not included in the list of nuclear species considered in Prometheus-HotB. (This specific choice had been taken to conserve the average mass number.) Here, we map all 52Fe and 56Ni (and its decay products 56Co and 56Fe) back into 54Fe in regions where the mass fraction of the tracer nucleus is less than 5e-13, thus restoring the original composition of the progenitor model, which does not contain any significant amounts of 52Fe, 56Ni, 56Co, or 56Fe in the layers outside the iron core. This choice of a discrimination value, X_Tr = 5e-13, was guided by an investigation of the outward-mixed 56Ni and tracer plume morphologies; see, e.g., the following two cross-sectional cuts of the 56Ni and tracer mass fractions at a time during shock breakout. The figures show the data before the remapping of the nuclear species was applied and motivate the conservative choice of X_Tr = 5e-13. In principle, a less conservative (i.e., larger) discrimination value could have been used, although with the risk of removing some of the explosively produced 56Ni (+ 56Co + 56Fe) and 52Fe. The following tables provide the total remaining yields of all considered nuclear species for different values of the tracer mass fraction used for the correction of the composition in the model s9.0 at different evolution times: 1.974 days, 3.278 days, and 19.738 days. For comparison, we also provide the pre-collapse composition of the s9.0 model in a table, which lists the masses of all considered nuclear species on the entire grid of the progenitor model and exterior to a "mass cut" of 1.355 solar masses (which corresponds to the baryonic neutron-star mass in the s9.0 model).
Here, we provide 3D model data that are mapped from the original Yin-Yang grid onto a spherical polar grid, at three different times: briefly before the fastest part of the shock reaches the stellar surface, briefly after the shock breakout from the stellar surface is completed, and at the end of the simulation. The data are composition-corrected (see note in section "3D data" above). The data are stored in the HDF5 format (https://www.hdfgroup.org/solutions/hdf5/) and zipped as tarballs ("<MODEL>_3D_spherical_<TIME>.h5.tar.gz"). See README for more details on the file format. The data of the s9.0 model are rotated (by 60 degrees around the x axis) such that the major nickel plume points in a direction perpendicular to the polar axis of the spherical grid.
s9.0_3D_spherical_001.974d.h5.tar.gz → at 1.974 days after bounce (~0.2 days before start of shock breakout) s9.0_3D_spherical_003.278d.h5.tar.gz → at 3.278 days after bounce (~0.2 days after completion of shock breakout) s9.0_3D_spherical_019.738d.h5.tar.gz → at 19.738 days after bounce (at the end of the simulation)Here, we provide angle-averaged 3D hydrodynamical data of the three models under consideration (e8.8, z9.6, s9.0), each at three different times: briefly before the fastest part of the shock reaches the stellar surface, briefly after the shock breakout from the stellar surface is completed, and at the end of the simulation (i.e., at the same times as the provided 3D data). The data are composition-corrected (see note in section "3D data" above). The files contain the radial grid, enclosed mass, density, specific internal and kinetic energies, pressure, specific entropy, temperature, radial velocity, mass fractions of nuclear species, and electron fraction. The data are stored in the HDF5 format (https://www.hdfgroup.org/solutions/hdf5/). See README for more details on the file format. We further provide the same data as plaintext ASCII files. The angle-averaged data of the s9.0 model at 1.974 days after onset of the explosion have been used as input for the study by Kozyreva et al. (2022). Model data of all three SN models (e8.8, z9.6, s9.0) similar to the angle-averaged radial profiles provided here have also been used in the work by Kozyreva et al. (2021). The post-processing analysis used to extract the present data has been refined slightly compared to an earlier version.
The data provided in this section have been used as input for the study by Kozyreva et al. (2022). We provide radial profiles of the hydrodynamical data (i.e., radial grid, enclosed mass, density, specific internal and kinetic energies, pressure, specific entropy, temperature, radial velocity, mass fractions of nuclear species, and electron fraction) of model s9.0 along selected angular directions, extracted shortly (~0.2 days) before the fastest part of the SN shock breaks out from the stellar surface (i.e., at 1.974 days after onset of the explosion). The radial profiles are provided for the following selected angular directions: along the direction of the maximum radius of the deformed shock (file suffix '000deg'), one in the opposite direction ('180deg'), one perpendicular ('090deg'), two along a (secondary) elongated 56Ni finger ('066.7deg' and '067.0deg'), and a larger set of directions within or close to the major 56Ni plume (with angular separations of 2-10 degrees relative to the '000deg' direction; file suffixes '002deg_a', '002deg_b', '004deg_a', ..., '010deg_b', where 'a' and 'b' distinguish directions on the same "cone" that are shifted by an azimuthal angle of 180 degrees around the '000deg' direction); see this overview plot showing the 56Ni profiles and the radial velocity profiles for the various directions. The data are stored in the HDF5 format (https://www.hdfgroup.org/solutions/hdf5/); see README for more details on the file format. We further provide the same data as plaintext ASCII files. The data are composition-corrected (see note in section "3D data" above).
In this overview table, we provide (4π) "isotropic equivalent" values of different quantities (56Ni mass, 56Co mass, total ejecta mass, internal, kinetic, gravitational, and total energies) for all selected angular directions, i.e., the values of the corresponding quantities which one would obtain under the assumption of spherical symmetry. For comparison, we also provide the corresponding values of the 3D model.
The "contour" files contain planar cuts of the specific entropy per baryon, density, radial velocity, and 56Ni+Tr mass fraction for the respective models (e8.8, z9.6, s9.0) in the same planes as presented in the paper. The videos labeled with "onset" show the onset and early phases of the explosions; the videos labeled with "late" show the long-time evolution (with "fast" and "slow" playback speed, respectively). The "3D_render" files contain videos of 3D renderings of the Ni+Tr=0.03 isosurface.
Planar cuts:
e8.8_contour_onset.mp4
e8.8_contour_late_fast.mp4
e8.8_contour_late_slow.mp4
z9.6_contour_onset.mp4
z9.6_contour_late_fast.mp4
z9.6_contour_late_slow.mp4
s9.0_contour_onset.mp4
s9.0_contour_late_fast.mp4
s9.0_contour_late_slow.mp4
e8.8_3D_render.mp4
z9.6_3D_render.mp4
s9.0_3D_render.mp4
The following files provide the data for a subset of the figures in Stockinger et al. (2020), stored in the HDF5 format (https://www.hdfgroup.org/solutions/hdf5/).
The following additional files provide angle-averaged 3D-Vertex data for neutrino luminosities and mean energies until 0.45 s (0.49 s) post bounce (as shown in Fig. 5 of Stockinger et al. (2020)) and 1D-Vertex neutrino data (matched continuously to the 3D spherically averaged ones) at t > 0.45 s (0.49 s) for model z9.6 (s9.0). The 1D-Vertex neutrino data have been used for the Prometheus-Vertex extension runs with simplified neutrino treatment (see Appendix E in the paper). The neutrino data are evaluated at 400 km for a lab-frame observer at large distance (i.e., gravitationally redshifted to infinity). The data are provided in HDF5 as well as in plaintext ASCII format.
z9.6_neutrino_signals.h5,
s9.0_neutrino_signals.h5,
s9.0_neutrino_signals.txt
(M_ns,b = 1.35 M_sun, M_ns,g = 1.23 M_sun)