 |
 |
|
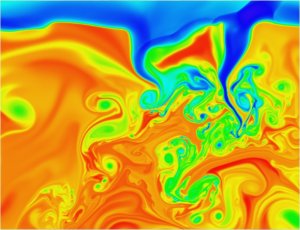
Fig. 1:
The figure shows a region 2600 km wide and 2000 km deep.
Horizontal and vertical resolution are 3 km and 2 km, respectively. The
region is embedded in a domain 11200 km wide and 3000 km deep simulated at
a resolution of 12 km by 8 km. The upper panel shows the simulated region,
the lower panel illustrates the scales. The quantity displayed is entropy.
It is tightly related to temperature and allows tracing the origin of the
gas. High entropy gas is colored in red and originates from further
inside. Low entropy gas is colored in blue and has been cooled at the
surface layers. Intermediate values are shown in green and yellow. The
latter are also found at the transition between the visible layers (near
the top) and the hidden layers underneath as a sharp, but smooth boundary
within the uppermost part of the figure.
|
 |
 |
|
Fig. 2:
The movie shows the development of temperature in
the same region for the same simulation as in Fig. 1, but at an
earlier instant in time. It illustrates the development from a state
as seen at lower resolution (first frame) to the development of small
scale structures (already after the first 40 out of 262 frames). The
quantity shown is the difference between local temperature and
horizontally averaged temperature (both on a logarithmic
scale). Regions hotter than average appear in red, regions colder than
average in blue, regions close to the average in green. Narrow black
lines connect locations with identical difference of pressure to its
horizontal average, a bit similar to a chart in a weather
forecast. But note that here the vertical direction (X) indeed
corresponds to the vertical direction in the simulation (Y is the
horizontal direction, indicated by arrows near the top) and in a
forecast chart isolines would connect locations of identical local
pressure. (Extended version of the  movie, 32 MB) movie, 32 MB)
|
|
 |
|
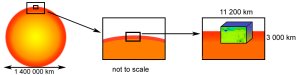
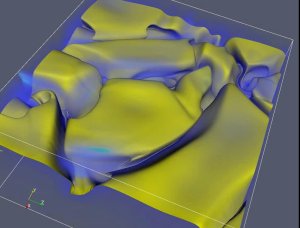
Fig. 3:
The movie shows a region 4000 km wide in each
horizontal direction (Y, Z) and 2000 km deep (X). Horizontal and
vertical resolution are 10 km and 7 km, respectively. The region is
embedded in a domain 11200 km wide and 3000 km deep simulated at a
resolution of 40 km horizontally and 28 km vertically. The dark
yellow surface connects all points with a temperature of 8000
K. Volume rendering is used to visualize regions with large pressure
gradients. The physical quantity chosen for this purpose is the norm
(size) of the gradient of differences between local pressure and its
horizontal average (both taken in logarithmic units). This way
locations with strong local changes in pressure are shown in
red. Moderate changes are in blue, while green and bright yellow
denote values in between.
|
| |
Observations of the surface of our Sun reveal a well-known granulation
pattern of visually bright structures (the granules) embedded in a
network of gas with a much lower visual brightness. On average such
granules are about 1200 km wide. Within the granules gas is hotter
than its environment. It moves upwards at some 2 km/s until radiation
into space provides sufficient cooling. Pushed sidewards the cold and
dense gas sinks downwards in a network surrounding the granules. The
best instruments available for taking images of the solar surface can
detect details as small as 70 km (examples:
 NAOJ
Institute for Solar Physics).
At that resolution the granules
appear remarkably smooth. This has also been found in numerical
simulations of solar granulation at similar resolution. What if we
looked at these layers, but were able to spot details as small as a
few km? Since each granule is influenced also by its environment,
numerical simulations of this process have to be performed for a much
larger domain, more than 10000 km wide and 3000 km deep. Even on
massively parallel computers a smaller region of interest has to be
selected to predict the dynamical behavior of such tiny
structures. This smaller region contains only a few granules. Its
surroundings are simulated at lower resolution. Fig. 1 shows such a
simulation, which has been performed taking into account only one
horizontal direction. The solar surface is clearly visible as a
vertically narrow and highly corrugated region which is thus located
at various geometrical depths. Most small scale details are related to
a few fronts moving upwards within the visible solar atmosphere.
This picture agrees with images of the solar surface and physical
explanations given for it in the literature, but here we look at
that phenomenon at a much higher resolution.
The region underneath
the surface looks completely different: the longer the gas has had
time to sink into the interior, the more details appear. The small
scale structures mostly originate from shear stresses between the
regions of upwards and downwards flowing gas. NAOJ
Institute for Solar Physics).
At that resolution the granules
appear remarkably smooth. This has also been found in numerical
simulations of solar granulation at similar resolution. What if we
looked at these layers, but were able to spot details as small as a
few km? Since each granule is influenced also by its environment,
numerical simulations of this process have to be performed for a much
larger domain, more than 10000 km wide and 3000 km deep. Even on
massively parallel computers a smaller region of interest has to be
selected to predict the dynamical behavior of such tiny
structures. This smaller region contains only a few granules. Its
surroundings are simulated at lower resolution. Fig. 1 shows such a
simulation, which has been performed taking into account only one
horizontal direction. The solar surface is clearly visible as a
vertically narrow and highly corrugated region which is thus located
at various geometrical depths. Most small scale details are related to
a few fronts moving upwards within the visible solar atmosphere.
This picture agrees with images of the solar surface and physical
explanations given for it in the literature, but here we look at
that phenomenon at a much higher resolution.
The region underneath
the surface looks completely different: the longer the gas has had
time to sink into the interior, the more details appear. The small
scale structures mostly originate from shear stresses between the
regions of upwards and downwards flowing gas.
Such small scale structures do not appear unless a minimum amount of
resolution and advanced numerical methods are used for the
simulations. This has been double-checked both with simulations at
lower resolution and by using various numerical methods. The results
just described are corroborated by the finding that once the
resolution is high enough different numerical methods yield more and
more similar results. Since the highly turbulent flow structures in
Fig. 1 are hidden by layers of opaque gas (the visible solar surface),
one has to look for indirect observational consequences. One
possibility are oscillations and waves generated by the flow. The Sun
is known to pulsate and these pulsations are the best "probe"
available for the structure of the solar interior. They are (standing)
sound waves trapped in the solar envelope. Most of the energy is
transferred into these waves in the layers right underneath the solar
surface, just where all the small scale structures appear (Fig. 1). An
analysis of the simulations reveals numerous "acoustic events", pulses
which are generated near regions where up- and downflows create large
shearing forces and where regions of lower density are suddenly
compressed. Fig. 2 shows a movie which illustrates these pulses as
black lines connecting locations which have identical differences
between local and horizontally averaged pressure. These pressure
fluctuations travel usually non-aligned to the actual flow. The latter
becomes visible through the development of the temperature
fluctuations (color coded). The pulses cross each other, get damped or
amplified, and some make their way up to the visible surface. How are
they related to the observed oscillations, which in fact take place at
length scales of at least a few granules and larger?
To answer this question requires more realistic simulations which
account for both horizontal directions. The restriction to two
dimensions creates features which are not expected (nor observed) for
the real solar convection, such as the stable whirls notable in both
Fig. 1 and the movie in Fig. 2 (which do not reach the surface). The
computational requirements for such a three-dimensional simulation are
considerable and to achieve the same resolution as in Fig. 2 means to
push the top supercomputers of today to their very limits. Fig. 3
shows results from a first series of such simulations, at roughly one
third of the resolution achieved in the case of two dimensions. The
increase in complexity in the flow is evident by following the
development from the initial stage (at a resolution which is
effectively comparable to that one achieved in images of the solar
surface by the most advanced instruments) to its final one. In real
solar time this is just a few minutes later, slightly shorter than the
development shown in Fig. 2. The smooth surface denotes a temperature
region just underneath the visible layers of the Sun and its
development illustrates, how upflows decay (and reappear) in time and
how their boundaries to downflow regions become disrupted by
shearing. In time, fronts of strong pressure differences (yellow-red)
appear particularly at the boundary regions of upflows (the interior
part of the granules) and they move further upwards. The appearance of
these phenomena and the drastic increase in complexity within the
regions of strong downflows motivates simulations similar in
resolution to those in Fig. 2 to clarify the role of shear stresses in
the generation of sound waves in the Sun. These are now conducted as
part of an accepted
DEISA
proposal.
However, already now it is clearly perceivable that what looks smooth
from the outside at currently achievable observational resolution
appears quite different, if studied with methods that can look into the
Sun at higher resolution.
Friedrich Kupka, Herbert J. Muthsam, Christof Obertscheider, Florian Zaussinger
Reference:
Muthsam et al., Mon. Not. Roy. Astr. Soc. 380, 1335-1340 (2007)
doi:10.1111/j.1365-2966.2007.12185.x
|