 |
|
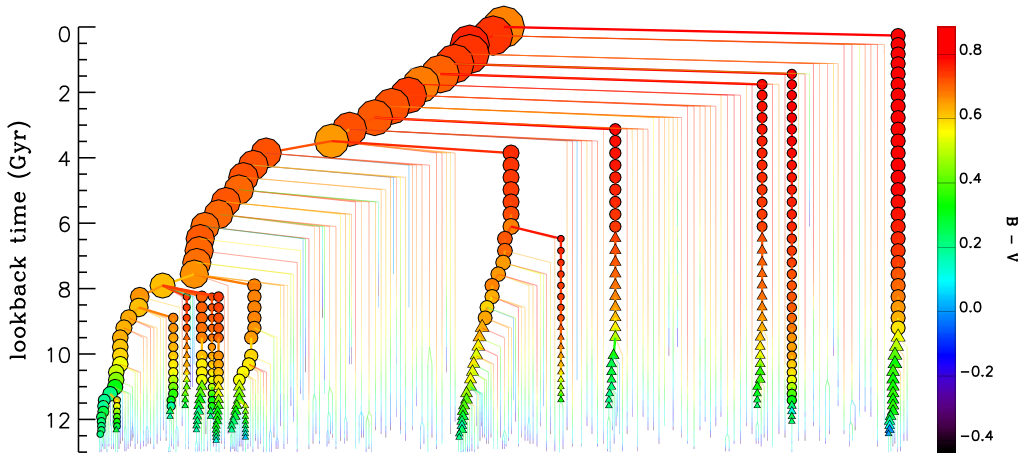
Fig. 1:
The "merger tree" of a model BCG.
|
 |
 |
|
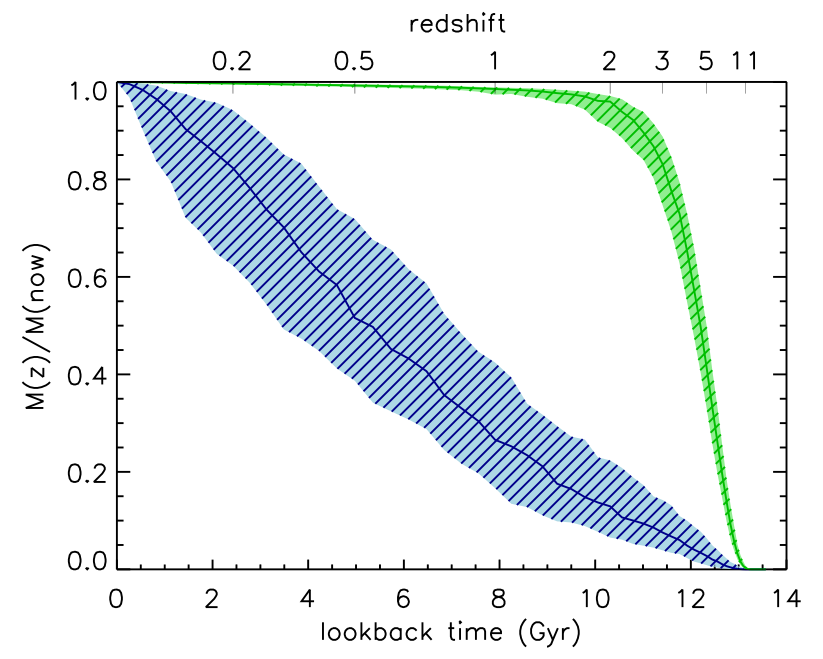
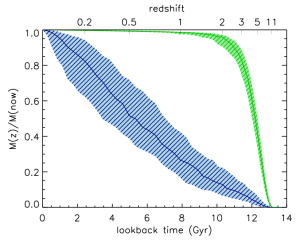
Fig. 2:
Assembly (blue) and formation (green) histories of model BCGs.
The solid lines indicate the median value, and the dashed regions
indicate the scatter.
|
| |
Brightest cluster galaxies (BCGs) are the very luminous galaxies that inhabit
the cores of rich galaxy clusters (
 Research Highlight November 2003 ,
Research Highlight March 2007 ). These galaxies are
among the most luminous and most massive systems in the Universe at the present
epoch, and their formation involves complex physical processes like "cooling
flows" and "cannibalism". The former mechanism is related to the fact that the
hot gas (typically 2-14 keV) in the cores of galaxy clusters can lose energy
via X-ray radiation. As the gas cools, the pressure decreases so that the
intra-cluster medium gradually contracts. The second mechanism is due to the
loss of momentum and kinetic energy of moving bodies through gravitational
interaction with the surrounding matter. As a consequence, galaxies orbiting
in a galaxy cluster, gradually sink towards the centre, eventually merging with
the central galaxy.
Research Highlight November 2003 ,
Research Highlight March 2007 ). These galaxies are
among the most luminous and most massive systems in the Universe at the present
epoch, and their formation involves complex physical processes like "cooling
flows" and "cannibalism". The former mechanism is related to the fact that the
hot gas (typically 2-14 keV) in the cores of galaxy clusters can lose energy
via X-ray radiation. As the gas cools, the pressure decreases so that the
intra-cluster medium gradually contracts. The second mechanism is due to the
loss of momentum and kinetic energy of moving bodies through gravitational
interaction with the surrounding matter. As a consequence, galaxies orbiting
in a galaxy cluster, gradually sink towards the centre, eventually merging with
the central galaxy.
Scientists at MPA have studied the formation and evolution of BCGs taking
advantage of the largest dark matter cosmological simulation carried out so far
- the Millennium Simulation
(
Research Highlight August 2004).
In order to model the observable properties of the galaxies (like their mass,
luminosity, colour, etc.), Gabriella De Lucia & Jeremy Blaizot have coupled the
high-resolution N-body simulation to semi-analytic models of galaxy formation
(
Research Highlight May 2004).
In these models, the
evolution of the baryonic components (gas and stars) is "painted" on top of the
history of dark matter haloes using simple relations that are supported by
observational data and by theoretical arguments.
Fig.1 shows the "history" of a BCG. In the astronomical jargon, this diagram
is referred to as "galaxy merger tree", and it can be considered as the
equivalent of a family tree. The BCG itself is plotted at the top, and all its
progenitors (and also their histories) are plotted backward in time
recursively. Galaxies with stellar masses larger than ~10^10 Msun are shown as
symbols, while lower mass galaxies are shown as lines. The size of the symbols
scales with stellar mass, while the colour scales with the colour of the galaxy
itself, which can be considered as a proxy for the age of the stellar
population. The left-most branch in Fig.1 represents what is usually called
"main branch". This is obtained by connecting the galaxy at each time-step to
the progenitor with the largest stellar mass (the main progenitor) at the
previous time-step. Fig.1 shows that this particular branch does not contain
all the information needed to explain the properties of the final galaxy. When
viewed at earlier times, the BCG is no longer a single object, rather it is the
"ensemble" of its progenitors at that time. At late times, the main branch
contains most of the final mass, but this is not true at earlier times when the
main progenitor is only marginally more massive than other branches of the
tree.
Given the complexity of the merger history shown in Fig.1, it is helpful to
define some "times" that mark important phases in the evolution of a BCG. In
particular, we call "assembly time" the time when the main progenitor contains
half the final stellar mass of the BCG, and "formation time" as the time when
the total mass of stars formed reaches half of the final mass. By total mass,
we mean, at each cosmic time, the sum of the stellar masses of all the
progenitors present at a given time, i.e. the projection of Fig. 1 onto the
vertical time axis.
Fig. 2 shows the evolution of the mass in the main branch (blue) and of the
total mass of stars formed (green) as a function of cosmic time. The solid
lines and the dashed regions in Fig.2 show the median and the scatter obtained
considering an ensemble of 125 BCGs. For essentially all the objects in the
sample, half of the stars that end up in the final galaxy are already formed
more than 10 billion years ago. Only at much later times (typically after
about 7 billion years) these stars merge toghether to form a single massive
system. Since, however, most of the galaxies accreted onto BCGs have little
gas and are already dominated by old stars, this late accretion does not change
the apparent age of BCGs at present time.
Model BCGs are therefore old (i.e. their stars formed very early), but their
mass assembled quite late. The increase in mass in the last ~8 billion years
found by these models, appears to be in qualitative agreement with
observational data. Future detailed comparisons with observations will provide
strong constraints on the physical processes regulating the formation and
evolution of this special class of objects.
Gabriella De Lucia and Jeremy Blaizot
Publication
Gabriella De Lucia, Jeremy Blaizot
"The hierarchical formation of the
brightest cluster galaxies",
Mon. Not. R. Astron. Soc., 375, 2 (2007)
|