|
|  |
All galaxies are permeated by magnetic fields, including our own Milky
Way galaxy. Despite intensive research, the origin of galactic
magnetic fields is still unknown. One assumes, however, that they are
built up by dynamo processes in which mechanical energy is converted
into magnetic energy. Similar processes occur in the interior of the
earth, the sun, and - in the broadest sense - in the gadgets that power
bicycle lights through peddling. By revealing the magnetic field
structure throughout the Milky Way, the new map provides important
insights into the machinery of galactic dynamos.
One way to measure cosmic magnetic fields, which has been known for
over 150 years, makes use of an effect known as Faraday rotation. When
polarized light passes through a magnetized medium, the plane of
polarization rotates. The amount of rotation depends, among other
things, on the strength and direction of the magnetic field.
Therefore, observing such rotation allows one to investigate the
properties of the intervening magnetic fields.
To measure the magnetic field of our own galaxy, radio astronomers
observe the polarized light from distant radio sources, which passes
through the Milky Way on its way to the Earth. The amount of rotation
due to the Faraday effect can be deduced by measuring the polarization
of the source at several frequencies.
Each such measurement can only provide information about a single path
through the Galaxy. To get a complete picture of the magnetic fields
in the Milky Way from Faraday rotation measurements, one must observe
many sources distributed across the entire sky. A large international
collaboration of radio astronomers have provided data from 26
different projects to give a total of 41,330 individual measurements.
On average, the complete catalog contains approximately one radio
source per square degree of sky.
Even with so much data, coverage of the sky is still rather sparse.
There remain large regions, especially in the southern sky, where so
far only relatively few measurements have been made. Therefore, to
obtain a realistic map of the entire sky, one must interpolate between
the existing data points. Here, two difficulties arise. First, the
respective measurement accuracies vary greatly, and more precise
measurements should have a greater influence. Also, the extent to
which a single measurement point can provide reliable information
about its surrounding environment is not known. This information must
therefore be directly inferred from the data itself.
In addition, there is another problem. The measurement uncertainties
are themselves uncertain owing to the highly complex measurement
process. It so happens that the actual measurement error for a small
but significant portion of the data can be more than ten times as
large as those indicated by the astronomers. The perceived accuracy of
these outliers can strongly distort the resulting map if one does not
correct for this effect.
To account for such problems, scientists at MPA have developed a new
algorithm for image reconstruction called the "extended critical
filter". To derive this algorithm, the team makes use of the tools
provided by the new discipline known as information field
theory. Information field theory incorporates logical and statistical
methods applied to fields, and is a very powerful tool for dealing
with inaccurate information. The approach is quite general and can be
of benefit in a variety of image and signal-processing applications,
not only in astronomy, but also in other fields such as medicine or
geography.
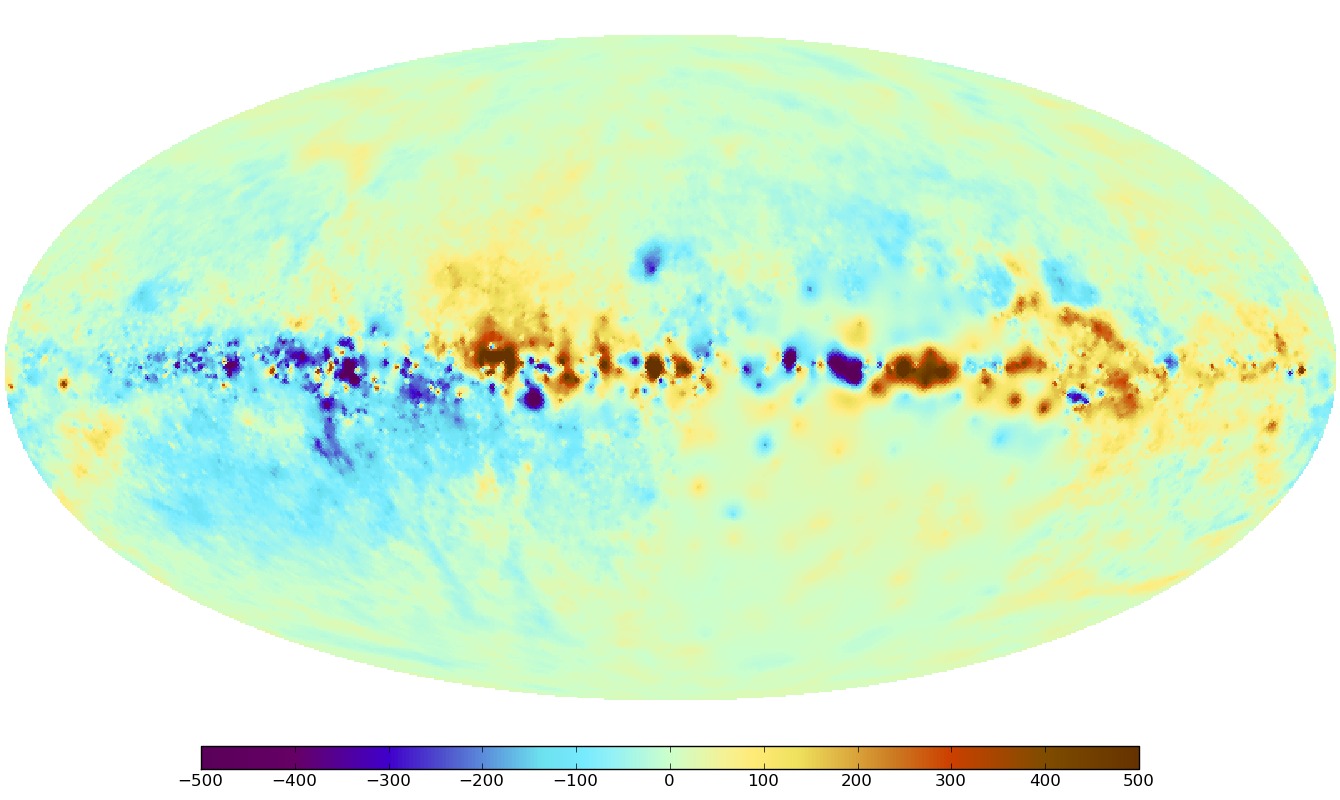
In addition to the detailed Faraday depth map (Fig. 1), the algorithm
provides a map of the uncertainties (Fig. 2). Especially in the
galactic disk and in the less well-observed region around the south
celestial pole (bottom right quadrant), the uncertainties are
significantly larger.
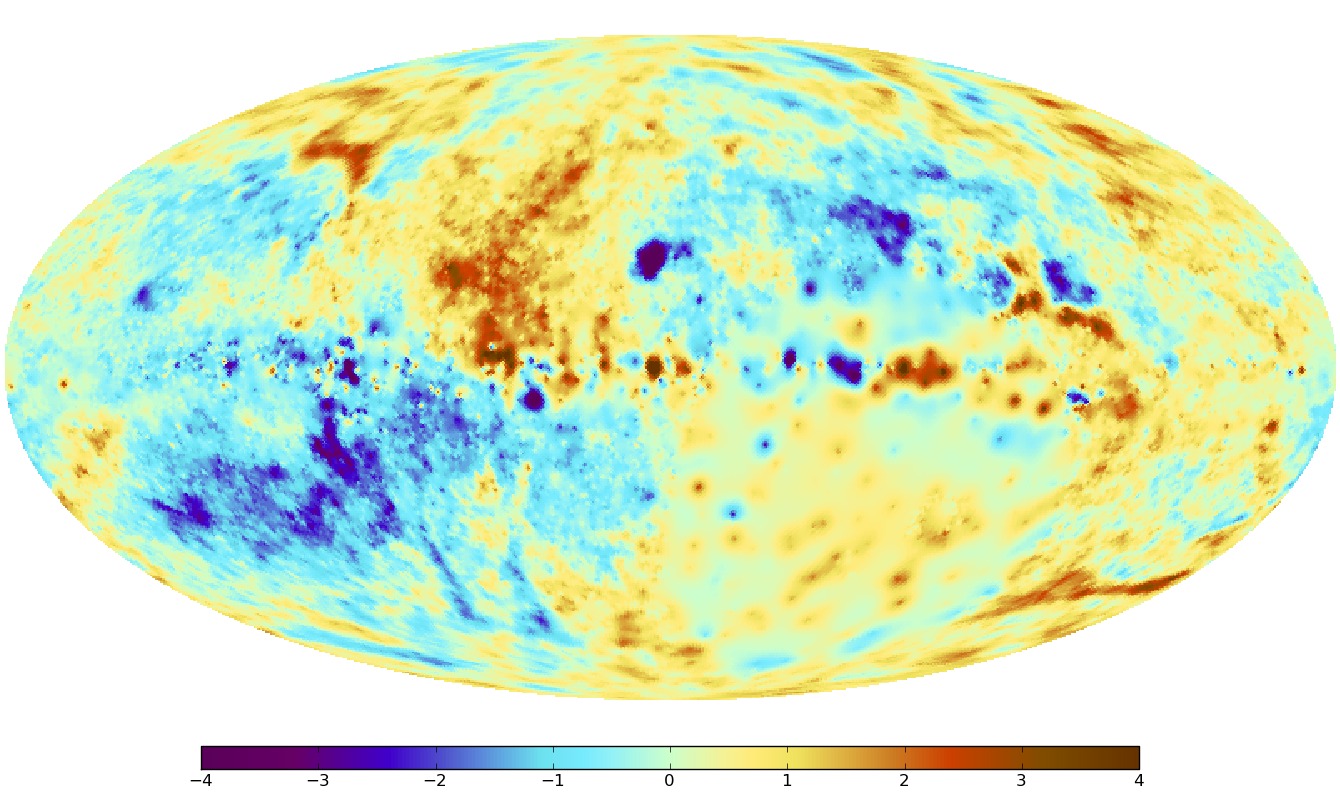
To better emphasize the structures in the galactic magnetic field, in
Figure 3 the effect of the galactic disk has been removed so that
weaker features above and below the galactic disk are more
visible. This reveals not only the conspicuous horizontal band of the
gas disk of our Milky Way in the middle of the picture, but also that
the magnetic field directions seem to be opposite above and below the
disk. An analogous change of direction also takes place between the
left and right sides of the image, from one side of the center of the
Milky Way to the other.
A particular scenario in galactic dynamo theory predicts such
symmetrical structures, which is supported by the newly created
map. In this scenario, the magnetic fields are predominantly aligned
parallel to the plane of the galactic disk in a circular or spiral
configuration. The direction of the spiral is opposite above and
below the galactic disk (Fig. 3). The observed symmetries in the
Faraday map stem from our position within the galactic disk.
In addition to these large-scale structures, several smaller
structures are apparent as well. These are associated with turbulent
eddies and lumps in the highly dynamic gas of the Milky Way. The new
map making algorithm provides, as a by-product, a characterization of
the size distribution of these turbulent structures, the so-called
power spectrum. Larger structures are more pronounced than smaller, as
is typical for turbulent systems. This spectrum can be directly
compared with computer simulations of the turbulent gas and magnetic
field dynamics in our galaxy, thus allowing for detailed tests of
galactic dynamo models.
The new map is not only interesting for the study of our
galaxy. Future studies of extragalactic magnetic fields will draw on
this map to account for contamination from the Galactic
contribution. The next generation of radio telescopes, such as LOFAR,
eVLA, ASKAP, Meerkat and the SKA, are expected in the coming years and
decades, and with them will come a wealth of new measurements of the
Faraday effect. New data will prompt updates to the image of the
Faraday sky. Perhaps this map will show the way to the hidden origin
of galactic magnetic fields.
Original publication:
Niels Oppermann, Henrik Junklewitz, Georg Robbers, Mike R. Bell, Torsten A.
Enßin, Annalisa Bonafede, Robert Braun, Jo-Anne C. Brown, Tracy E. Clarke,
Ilana J. Feain, Bryan M. Gaensler, Alison Hammond, Lisa Harvey-Smith,
George Heald, Melanie Johnston-Hollitt, Uli Klein, Phil P. Kronberg, S.
Ann Mao, Naomi M. McClure-Griffiths, Shane P. O'Sullivan, Luke Pratley,
Tim Robishaw, Subhashis Roy, Dominic H.F.M. Schnitzeler, Carlos
Sotomayor-Beltran, Jamie Stevens, Jeroen M. Stil, Caleb Sunstrum, Anant
Tanna, A. Russell Taylor, and Cameron L. Van Eck,
"An improved map of the galactic Faraday sky",
2011, submitted
 http://arxiv.org/abs/1111.6186 http://arxiv.org/abs/1111.6186
Niels Oppermann, Georg Robbers, Torsten A. Enßlin,
"Reconstructing signals from noisy data with unknown signal and noise covariances",
2011, Physical Review E 84, 041118
http://arxiv.org/abs/1107.2384
Torsten A. Enßlin, Mona Frommert, Francisco S. Kitaura,
"Information field theory for cosmological perturbation reconstruction and non-linear signal analysis",
2009, Phys. Rev. D 80, 105005
http://arxiv.org/abs/0806.3474
For more information:
 Interactive map and pictures Faraday Interactive map and pictures Faraday
Information field theory
Contact:
Niels Oppermann
Tel. 089 30000-2269
E-mail: noppermann mpa-garching.mpg.de mpa-garching.mpg.de
Torsten Enßlin
Tel. 089 30000-2243
E-mail: tensslinmpa-garching.mpg.de
Hannelore Hämmerle
Tel. 089 30000-3980
E-mail: prmpa-garching.mpg.de
|