|
|
|
|
|
|
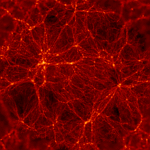 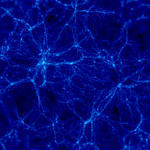
red Large (1500x1500 pixels) Small (400x400 pixels) |
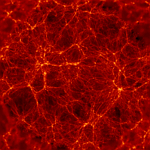 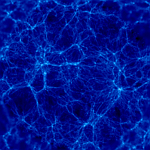
red Large (1500x1500 pixels) Small (400x400 pixels) |
|
|
Large (1500x1500 pixels) Small (400x400 pixels) |
Large (1500x1500 pixels) Small (400x400 pixels) |
|
|
Springel, Mathis, White, Lemson, Kauffmann, Dekel & GIF-consortium, 1998
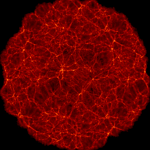
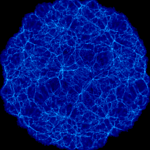
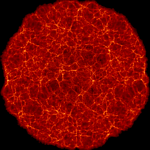
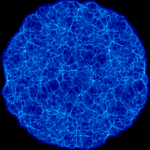
We have carried out two simulations that mimic the Local Universe, CR-TCDM and CR-LCDM. The initial conditions of these simulations have been constrained by the smoothed density field of the 1.2-Jy redshift survey of IRAS galaxies. As a result, the simulations develop the same prominent large-scale structure as observed in the Local Universe, i.e. the N-body models develop structures corresponding to the Great Attractor or the Cetus Wall. Also, clusters like Perseus-Pisces, Hercules-Centaurus, Pavo-Indus-Telescopium, Virgo, or Coma are all found at the right place.
The simulations follow the evolution of a comoving sphere of diameter 416 Mpc/h. In the central region of radius ~ 80 Mpc/h around 53 million particles are used, while the surrounding boundary region is sampled with 20 million particles. The gravitational softening in the high-resolution zone is 20 kpc/h. The simulations have been carried out with the GADGET code on the Garching T3E.
Each of the pictures available on this page shows the projected particle distribution of a slice of thickness 12 Mpc/h through the supergalactic plane. The pictures referred to as high-res-zone have a comoving side length of 170 Mpc/h and show the central high-resolution zone of the simulations. The images labelled full simulation are slices of side length 420 Mpc/h through the full (spherical) simulation volume.
Each of the pictures is available in two color scales (red and blue), and at two different resolutions (400x400 and 1500x1500 pixels). For the 1500x1500 pixel images (size ~ 1Mbyte), you should have a fast internet connection, a large color screen, and a good browser, preferably all three of these. I recommend that you start `netscape' with the `-install' option on 256 color displays, otherwise the colors might be compromised.
In the table below, just click on the links of the images you want to look at. A direct comparison of the low resolution images is also avaliable.
The color scale of the images maps the logarithmic surface mass density of the slices. In each case, the color scale extends from 0.01 times the mean density to the maximum surface density of the slice.
|
|
|
|
|
|
|
|
 
red Large (1500x1500 pixels) Small (400x400 pixels) |
 
red Large (1500x1500 pixels) Small (400x400 pixels) |
|
|
Large (1500x1500 pixels) Small (400x400 pixels) |
Large (1500x1500 pixels) Small (400x400 pixels) |
|
|
|
|
|
|
|
|
red Large (1500x1500 pixels) Small (400x400 pixels) |
red Large (1500x1500 pixels) Small (400x400 pixels) |
|
|
Large (1500x1500 pixels) Small (400x400 pixels) |
Large (1500x1500 pixels) Small (400x400 pixels) |
Last modified: Dec 14, 1998 volker@mpa-garching.mpg.de