Go to: -Models E15x/E20x -Models S11AxOy -Models S15AxOy -Models S20AxOy -Models S40AxOy Axisymmetric Core Collapse with Microphysics (Extended Model Set) Relativistic Hydrodynamics Waveform Catalog
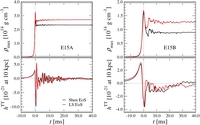
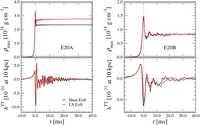
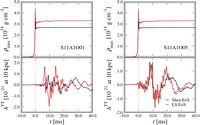
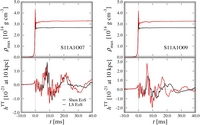
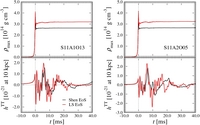
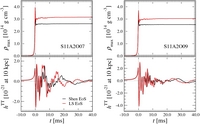
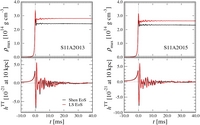
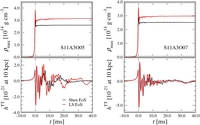
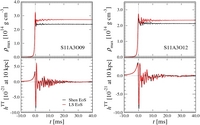
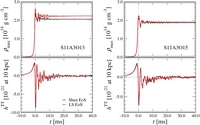
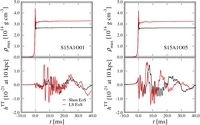
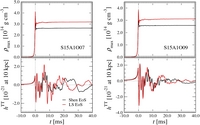
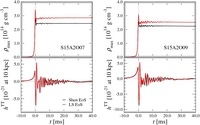
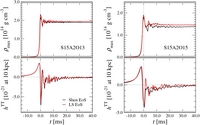
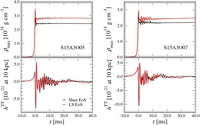
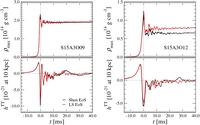
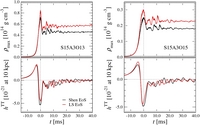
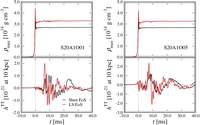
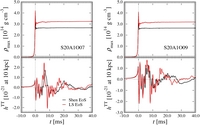
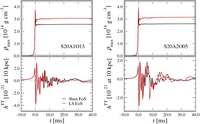
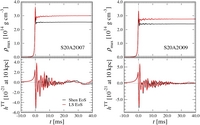
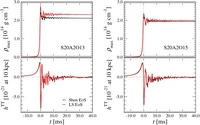
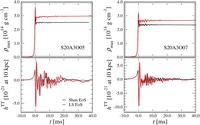
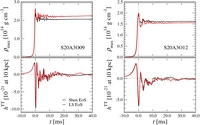
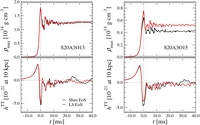
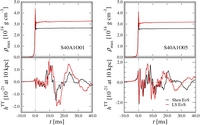
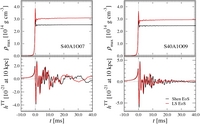
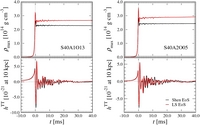
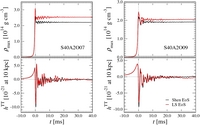
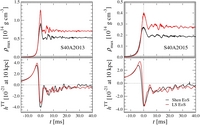
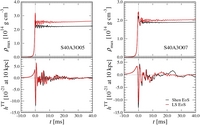
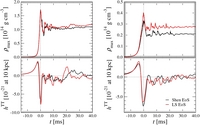
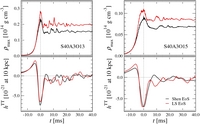
These figures contain the time evolution of the maximum density and the signal amplitude for all 136 simulated models.
The vertical dotted lines mark the time of peak maximum density (time of bounce).
(The figures are gzipped.)