Go to: -Models A1Bx -Models A2Bx -Models A3Bx Axisymmetric Core Collapse with Microphysics Relativistic Hydrodynamics Waveform Catalog
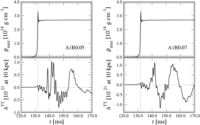
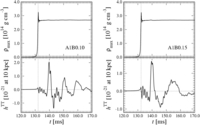
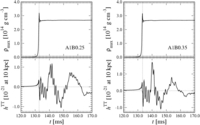
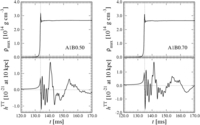
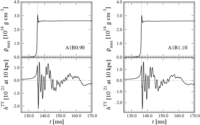
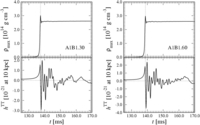
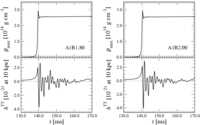
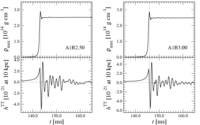
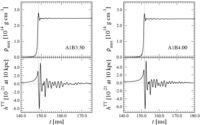
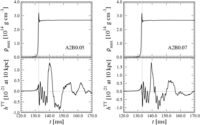
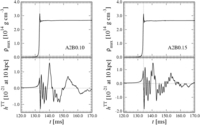
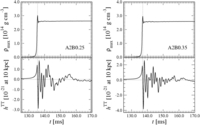
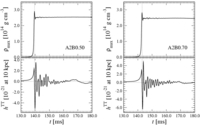
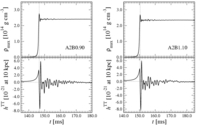
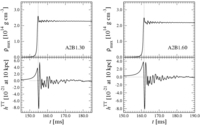
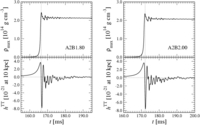
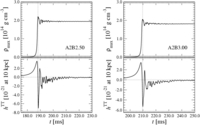
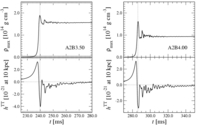
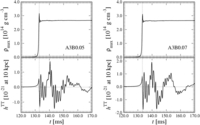
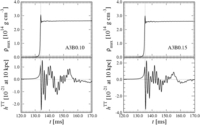
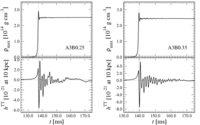
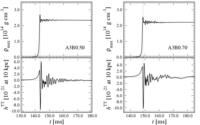
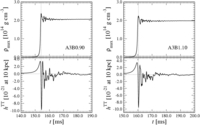
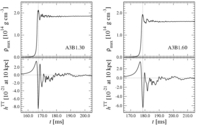
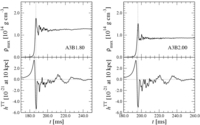
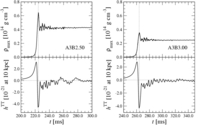
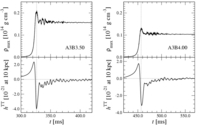
These figures contain the time evolution of the maximum density and the signal amplitude for all 54 simulated models.
The vertical dotted lines mark the time of peak maximum density (time of bounce).
(The figures are gzipped.)