| MPA-HOMEPAGE |
|
 |
Synthetic Light Curves of BL Lac Objects | ||
|
|
 Go to:
|
Petar Mimica Miguel-Angel Aloy Ewald Müler Wolfgang Brinkmann (  Introduction:
The supermassive black holes in the centers of galaxies are thought to be surrounded by the accretion disks, i.e., disks composed of gas falling towards the black hole. The matter is shot upwards and away from the black hole in the form of a collimated jet (see picture on the right; image credit: NASA/Honeywell Max Q Digital Group, Dana Berry). The nucleus of a galaxy which possesses a jet is called an active galactic nucleus (AGN).
The orientation of the jet with respect to the Earth plays an
important role. Indeed, in the past the AGNs were classified into
different classes according to their brightness and spectral
properties, but nowadays the so-called unification scenario proposes
that these apparent differences are only due to the different
orientation of the jet with respect to the observer
[Urry and Padovani, 1995]. The class of the AGNs whose
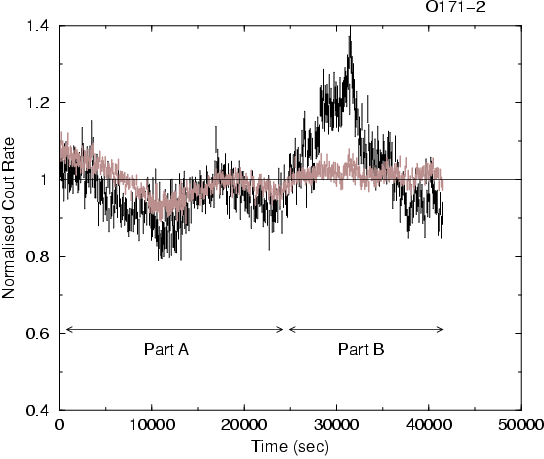
Another important feature of blazars is their raipd X-ray variability. Some of the sources exhibit an increase in X-ray luminosity over a time scale of a few hours (e.g., the source Mrk421, see [Brinkmann, et al., 2003]). The analysis of the temporal variations of the luminosity provides additional clues about the nature of these objects. 
The picture above shows the measurement of the X-ray luminosity of the
source Mrk 421 performed by the satellite
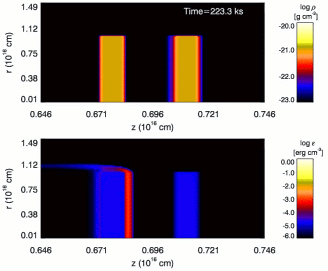
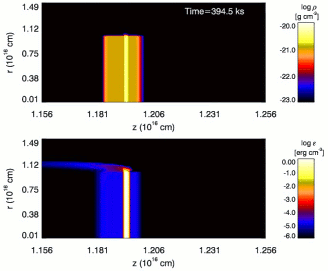
We have performed several high-resolution 2D relativistic hydrodynamic simulations of collisions of two dense gas shells [Mimica, et al. 2004]. The pictures below display two snapshots from one of the simulation. The upper panels show the logarithm of the fluid density and the lower panels show the internal energy density of the fluid. The coordinate system is cylindrical with the z coordinate being parallel to the jet axis (the jet is assumed to be axially symmetric). The observer is located far to the right. 
The upper picture shows the two shells before their collision. The shells are moving to the right. The left (faster) shell is moving with 99.78% of the speed of light (Lorentz factor 15), while the right (slower) shell is moving with 94.28% of the speed of light (Lorentz factor 3). 
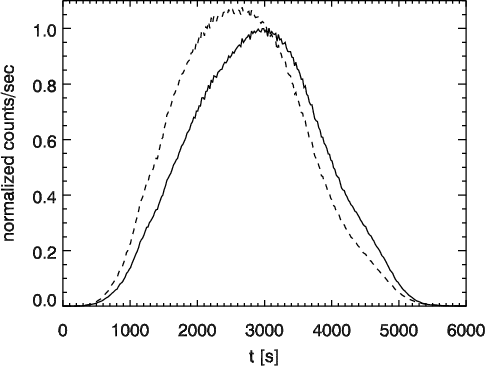
The lower picture shows the shells after the beginning of the interaction. What is clearly visible is the region of very high density and internal energy (bright yellow) between the two shells. The left edge of this region is the so-called reverse shock and the right edge is the forward shock. Viewed in the reference frame in which the faster shell is at rest, the reverse shock seems to be advancing through it. Similarly, viewed in the reference frame in which the slower shell is at rest, the forward shock seems to be advancing through it. Due to the fact that jets contain magnetic fields (as inferred, e.g., from the observations of the polarization of radio-emission), these shocks are able to accelerate electrons to very high energies, so that they start radiating non-thermal synchrotron radiation due to the very rapid gyration around the magnetic field lines. The synchrotron radiation from these ultrarelativistic electrons is visible in the X-ray band. Our simulations compute the X-ray emission from the forward and reverse shocks in the fluid and compute the light curve similar to the observed light curve (see figure below). 
The full line is the soft X-ray light curve, the dashed line is the hard X-ray light curve. The light curve is computed by summing up the contributions from all the time-steps of our simulations, so it is necessary to perform the full simulation before it is possible to know what the light curve will look like.
|