| MPA-HOMEPAGE |
|
 |
General Relativistic Simulations of Rotational Supernova Core Collapse in Axisymmetry | ||
|
|
 Go to:
|
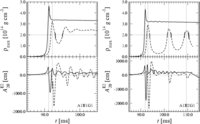
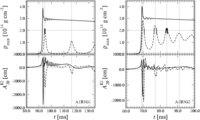
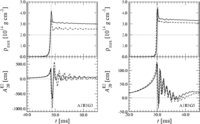
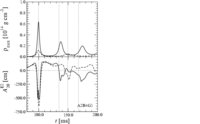
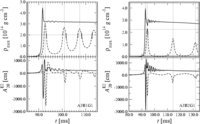
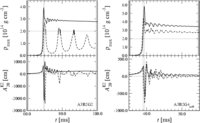
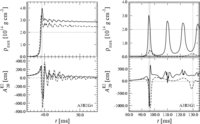
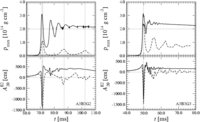
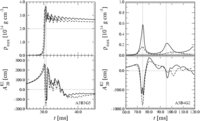
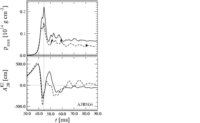
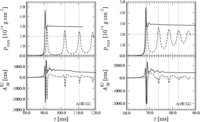
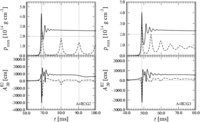
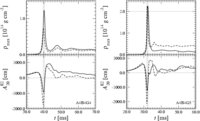
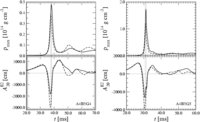
H. Dimmelmeier J.A. Font ( E. Müller Figures of the waveforms in EPS format: These figures contain the time evolution of the maximum density and the signal amplitude for all 26 simulated models. The solid and dashed lines denote the simulations in relativistic and Newtonian gravity, respectively. The signal amplitude AE220 can be converted to the strain hTT in the equatorial plane at a distance r from the source by the following expression:
The vertical dotted lines mark the time of peak maximum density (time of bounce), and the horizontal dotted lines in the density plots mark nuclear matter density, which we define as 2.0 . 1014 g/cm3. For non-toroidal models, the maximum density is identical to the central density.
| ||||||||||||||||||||||||