 |
|
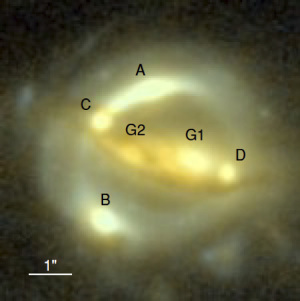
Figure 1:
Image of a strong lensing time delay system, B1608+656, taken by the Hubble
Space Telescope (from Suyu et al. 2010). The centre of the lens galaxy (G1) and
a satellite galaxy (G2) are surrounded by images of a background source (A, B,
C and D). The ordering of the images follows the arrival time.
(c) HST/NASA
|
 |
 |
|
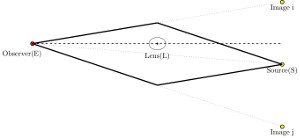
Figure 2:
Configuration of a strong gravitational lensing system. The thick solid line
shows the two different paths that photons emitted from the source could take.
The dotted lines show the angular positions where images and the source appear
on the sky. The position of the source, however, is usually not observable as
it
is very close to the lens. Note that the plot is not to scale: The distance
photons travel is much longer than the size of the lens or the source.
Credit: Jee, Komatsu and Suyu 2014
|
 |
 |
|
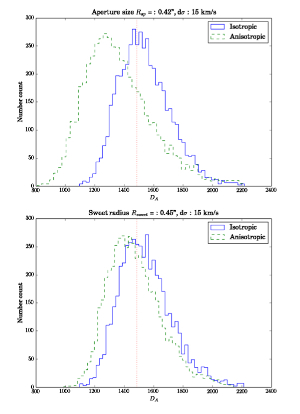
Figure 3:
Distribution of angular diameter distances calculated from (top) the
simulated aperture-averaged
velocity dispersion of the lens system B1608+656, and (bottom) the
velocity dispersion
measured at the sweet-spot radius (see Figure 1).
In both plots, the blue solid line shows the distribution when the input
model is isotropic,
whereas the green dashed line is the distribution when the simulated
velocity dispersion is anisotropic.
In the upper case, the distance can be determined to an accuracy of
about 15%.
If the radial profile of the velocity dispersion is taken into account
(using the "sweet spot", see text), as the bottom panel shows, the uncertainty
decreases to 12%
Credit: Jee, Komatsu and Suyu 2014
|
|  |
Observing the universe has a fundamental limitation: the 3-dimensional universe
is projected onto the 2-dimensional observation plane, which makes it hard to
know the 'depth' of the universe (in other words, how far an object is from
us).
As a consequence, astronomers rely on indirect methods to measure cosmological
distances.
There are two methods to achieve this goal: One is the so-called 'standard
candle' method, where the apparent luminosity of an object is compared to its
intrinsic brightness that is assumed to be known. Using Type Ia supernovae as a
standard candle, the method has led to the discovery of the accelerating
expansion of the universe and the existence of dark energy. The other method is
the 'standard ruler' method, which compares the apparent size of an object to
its intrinsic size. For example, large-scale galaxy surveys allowed astronomers
to use the so-called Baryonic Acoustic Oscillations as a standard ruler.
However, both existing methods have limitations. We still do not know the
progenitors of Type Ia supernovae, and thus using them to infer distances may
be
limited by our physical understanding of supernovae. The resources required to
measure Baryonic Acoustic Oscillations are large, as we need to take spectra of
millions of galaxies, and a given project takes many years and tens of millions
of euros (or more) to complete. Therefore, there is a strong desire to find
another candle or ruler, which is well understood physically and demands less
observational resources.
Recently, MPA scientists have substantially improved upon a method to use
strong
gravitational lens systems with measured time delays to infer the distance to
the lens. The method was first proposed in 2009 by Paraficz and Hjorth, but no
further study has been done since then. Strong gravitational lensing happens
when a massive galaxy is almost, but not exactly, aligned to a source quasar
that is located behind the galaxy. The light emitted from the source quasar
passes through the gravitational field of the galaxy and is slightly bent
towards the galaxy, according to General Relativity.
Each photon passing through a different part of the galaxy experiences a
different gravitational potential: As a result, the galaxy acts like an optical
lens and the photons taking separate paths produce multiple images around the
galaxy (see Figure 1). As each photon takes a different path to reach the
observer, the path lengths and thus the arrival times of the photons differ,
allowing the observer to measure the delay between each path as the source
quasar changes its brightness in time (see schematic in Figure 2). The time
difference between images is called the time delay.
The physics behind the new ruler method is simple. The measured time delay is
proportional to the mass of the galaxy. The measured velocity dispersion of the
galaxy gives the gravitational potential of the lens. Combining both
measurements yields the physical size of the lens. Then, by comparing the
physical size of the lens that has been calculated and the angular size of the
lens that has been observed, we can obtain the distance to the lens.
The angular diameter distance to the lens galaxy measured in this way can be
expressed in terms of several observables such as the time delay, velocity
dispersion, lens redshift, and image positions. It also depends on the
steepness
of the mass profile of the lens, which can be determined by analysing the shape
and brightness distributions of the lens and images.
One big advantage of this new method, which was found by scientists at MPA, is
that the effect of the external mass that lies along the line-of-sight between
the observer and the source, which is called the 'external convergence',
cancels
out. In other words, the angular diameter distance does not change under the
presence of external mass that causes extra bending of light rays. In
principle,
the external convergence acts like another lens added to the lens system, and
adds uncertainty to the traditional cosmological measurements using strong
lenses. A good analogy exists in the classical optics: It is impossible to tell
the difference between a single lens system with a given focal length, and a
multiple lens system consisting of lenses with different focal lengths which
collectively form a system with the same effective focal length as that of the
single lens. Likewise, gravitational lens systems with a single lens and
multiple lenses cannot be distinguished by observables.
However, in our case the resulting angular diameter distance does not depend on
the external convergence, since the time delay and the velocity dispersion are
both determined solely by the properties of the lens. Applying this method to
one of the existing lens systems, B1608+656 (Figure 1), the researchers find
that the distance can be measured with 15% accuracy (Figure 3).
This new method requires precise estimation of the mass and the potential of
the
system from data. Challenges lie both in the observation and the modelling of
the lens: Assuming that the lens galaxy (which is a massive elliptical galaxy
in
most cases) has reached dynamical equilibrium, the random motion of matter
particles inside the galaxy counteracts the gravitational force so that the
galaxy neither collapses nor expands. This is measured by the velocity
dispersion of stars with respect to the centre of the galaxy. The Jeans
equation
relates the radial component of the velocity dispersion to the gravitational
potential; however, it is impossible to observe just the radial component of
the
velocity dispersion. The measurement is done using the Doppler shift of stellar
light, which means that only the line-of-sight component of the velocity
dispersion is measurable. The fact that only the luminous tracers (such as
stars) can be measured results in the observation of projected, luminosity
weighted velocity dispersion. When the velocity dispersion is anisotropic, the
situation becomes even more complicated. Moreover, the measured velocity
dispersion is usually a quantity that is averaged over an aperture of size few
tenth of arc seconds. In the end, it is not easy to relate the value we observe
to the potential itself.
To overcome this complication, we use spatially resolved spectroscopy of the
lens galaxy to obtain the radial profile of the velocity dispersion. Then, we
use a radius at which the scatter between different anisotropic profiles is
minimised, the "sweet spot", which was derived previously by other researchers
at MPA (Churazov et al.). With this method, the uncertainty from the
anisotropic
velocity dispersion is minimised and the accuracy in the determination of the
angular diameter distance improves to 12%.
This study demonstrates that, using a strong lens galaxy with measured time
delays, the angular diameter distance can be measured accurately, providing a
powerful, new way to chart our universe.
Inh Jee, Eiichiro Komatsu and Sherry H. Suyu(ASIAA)
References:
Inh Jee, Eiichiro Komatsu, Sherry H. Suyu, Measuring angular diameter
distances of strong gravitational lenses,  arXiv:1410.7770 arXiv:1410.7770
|


