 |
|
Fig. 1:
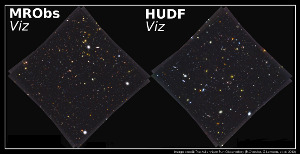
False-colour images of the Hubble Ultra Deep Field as
predicted by the Millennium Run Observatory (left) and as actually
observed by the Hubble Space Telescope (right). The images measure
about 5’ by 5’, and were constructed from virtual and real
observations through the filters V (blue), i (green), and z (red). The
resemblance between the virtual image constructed using the MRObs and
the actual image seen by HST is striking. The MRObs images can be
analysed in the same way as the real data, with the advantage that
only for the MRObs images the underlying “reality” is
known. Comparison of these kinds of simulated and real data will allow
astronomers to test their methods, test how well the simulations
reproduce the actual universe, and make predictions for future
observations.
|
 |
 |
|
Fig. 2:
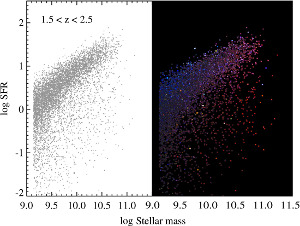
The MRObs observations allow us to visualize the colours,
shapes and sizes of galaxies as predicted by the simulations in ways
that were previously impossible. In the left panel, galaxies at z~2
are indicated according to their stellar masses and star formation
rates (SFR) as predicted by the simulations. In the panel on the
right, the same galaxies are plotted, but now they are shown as they
would appear in a simulated HST colour-composite image (with the same
quality as recent data from the GOODS/ERS programme). The diagram on
the right contains a wealth of extra information compared to the
standard diagram shown left: The simulated galaxy population at z~2
consists of a blue star-forming sequence as well as a population of
massive, red and compact galaxies in which star formation has already
shut down, qualitatively similar to observational findings. The MRObs
approach has the advantage of allowing astronomers to also
quantitatively investigate how the properties of real and simulated
galaxies compare.
|
 |
 |
|
Fig. 3:
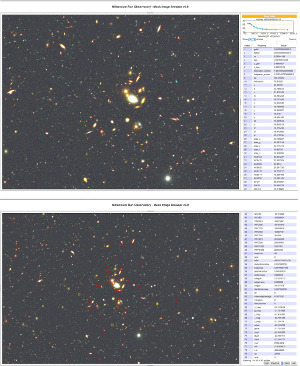
A screenshot of the MRObs browser, the new online tool provided
by MPA that allows users to explore the virtual observations and
interact with the underlying MR database. Top panel: basic view of the
browser showing a small region of a synthetic HST/GOODS observation (in
V, i, z filters). Users can pan around and zoom the synthetic
observation and query the MR database by clicking on a galaxy.
Information about the selected object (marked by a white square) is
retrieved from the MR database and displayed in the information panel on
the right-hand side of the screen. Bottom panel: the user can highlight
all galaxies belonging to the same “friends-of-friends” group as the
selected galaxy. In this case, the selected galaxy turns out to be the
central galaxy of a group at z~0.5.
|
|  |
Cosmological simulations aim to capture our current understanding of
galaxy evolution, aid in the interpretation of complex astronomical
observations, and make detailed predictions for future
experiments. Simulations and observations, however, are often compared
in a somewhat indirect way: physical quantities are estimated from the
observational data and compared to the models. An important
complication with this approach is that observations typically give a
highly distorted view of the universe, making the process of
extracting physical information a challenge.
Many problems in astrophysics could therefore benefit from doing it
the other way round: the entire observing process is applied to the
simulations, so that the models can be viewed fully from an observer’s
perspective. A small team composed of current and former members of
the Max Planck Institute for Astrophysics has now developed the
Millennium Run Observatory (MRObs), a theoretical, virtual observatory
that uses virtual telescopes to ‘observe’ semi-analytic galaxy
distributions based on the MR dark matter simulations developed at
MPA. The MRObs produces data that can be processed and analysed using
standard observational software packages developed for real
observations.
How does it work? The MRObs produces fully physically-motivated,
synthetic images of the night sky by stringing together a great number
of products from cosmological simulations, various existing astronomical
software packages, and software newly created for the MRObs. Halo merger
trees based on the MR simulation (using only dark matter) form the
backbone for the semi-analytic modelling of galaxies inside haloes. This
modelling is based on simple recipes for, e.g., gas cooling, star
formation, supernova and AGN heating, gas stripping and merging between
galaxies. At each time step of the simulation, the physical properties
of each galaxy are used to select stellar population templates from a
library of theoretical spectra to predict the intrinsic spectra.
‘Light cones’ are constructed that arrange the simulated galaxies in
a way that is similar to how galaxies appear to an observer on the sky.
Next, multi-band apparent magnitudes are calculated, including the
effects of absorption by the inter-galactic medium. The light cone is
then projected onto a virtual sky, and the positions, shapes, sizes and
observed-frame apparent magnitudes of the galaxies are used to build a
‘perfect’ or ‘pre-observation’ image. The perfect image is fed
into the MRObs telescope simulator that applies a detector model (pixel
scale, readout noise, dark current, sensitivity and gain), sky
background, point spread function, and noise. The result is a realistic,
synthetic telescope image. Source extraction algorithms are applied to
the simulated image resulting in a catalogue of the apparent properties
of all objects detected in the image. This catalogue of objects can be
cross-matched with the higher level data available in the MR database in
order to compare the real physical properties of the galaxies with those
extracted from the images.
The MRObs extends the MR simulations by producing data products that
most directly correspond to observations, namely synthetic images and
extracted source catalogues. The data simulated with the MRObs so far
includes portions of the Sloan Digital Sky Survey (SDSS), the Canada
France Hawaii Telescope Legacy Survey (CFHT-LS), the Great
Observatories Origins Deep Survey (GOODS), the GOODS WFC3 Early
Release Science (ERS), the Hubble Ultra Deep Field (HUDF, see Figure
1), as well as the Cosmic Assembly Near-IR Deep Extragalactic Legacy
Survey (CANDELS). The information provided covers light cone
catalogues linked to structural properties of galaxies,
pre-observation model images, mock telescope images and source
catalogues that can all be traced back to the dark matter,
semi-analytic galaxy and light cone catalogues already available in
the MR database. This will aid theorists in testing analytical models
against observations, aid observers in making detailed predictions for
observations as well as better analyses of observational data, and
allow the community to subject the models to new tests. For example,
the MRObs can be used to visualize the appearance of galaxy clusters,
to predict the structural properties of galaxies across the stellar
mass versus star formation rate plane (see Figure 2), or to answer the
question of how many galaxies could be detected at a redshift of about
10. The data can be explored interactively in the MRObs browser
(Figure 3).
The development of the MRObs coincides with the celebration of the
first 500 papers based on the MR simulations, proving that the MPA-led
Millennium Run project is still as successful today as it was 7 years
ago. Future expansions of the MRObs project are already underway, such
as incorporating the more recent Millennium-Run II and Millennium XXL
simulations to extend the dynamic range, implementing improved
cosmological parameters and galaxy modelling techniques, and creating
a wider range of virtual telescopes and simulated surveys that will
aid theorists and observers alike.
Roderik Overzier and Gerard Lemson
Further reading
Overzier, R., Lemson, G., Angulo, R., Bertin, E., Blaizot, J.,
Henriques, B., Marleau, G., White, S.,
"The Millennium Run Observatory: first light",
2012, MNRAS, in press
 (arXiv:1206.6923) (arXiv:1206.6923)
Further references
 Millennium Run Observatory Web Portal and access to the MRObs browser
|


