 |
|
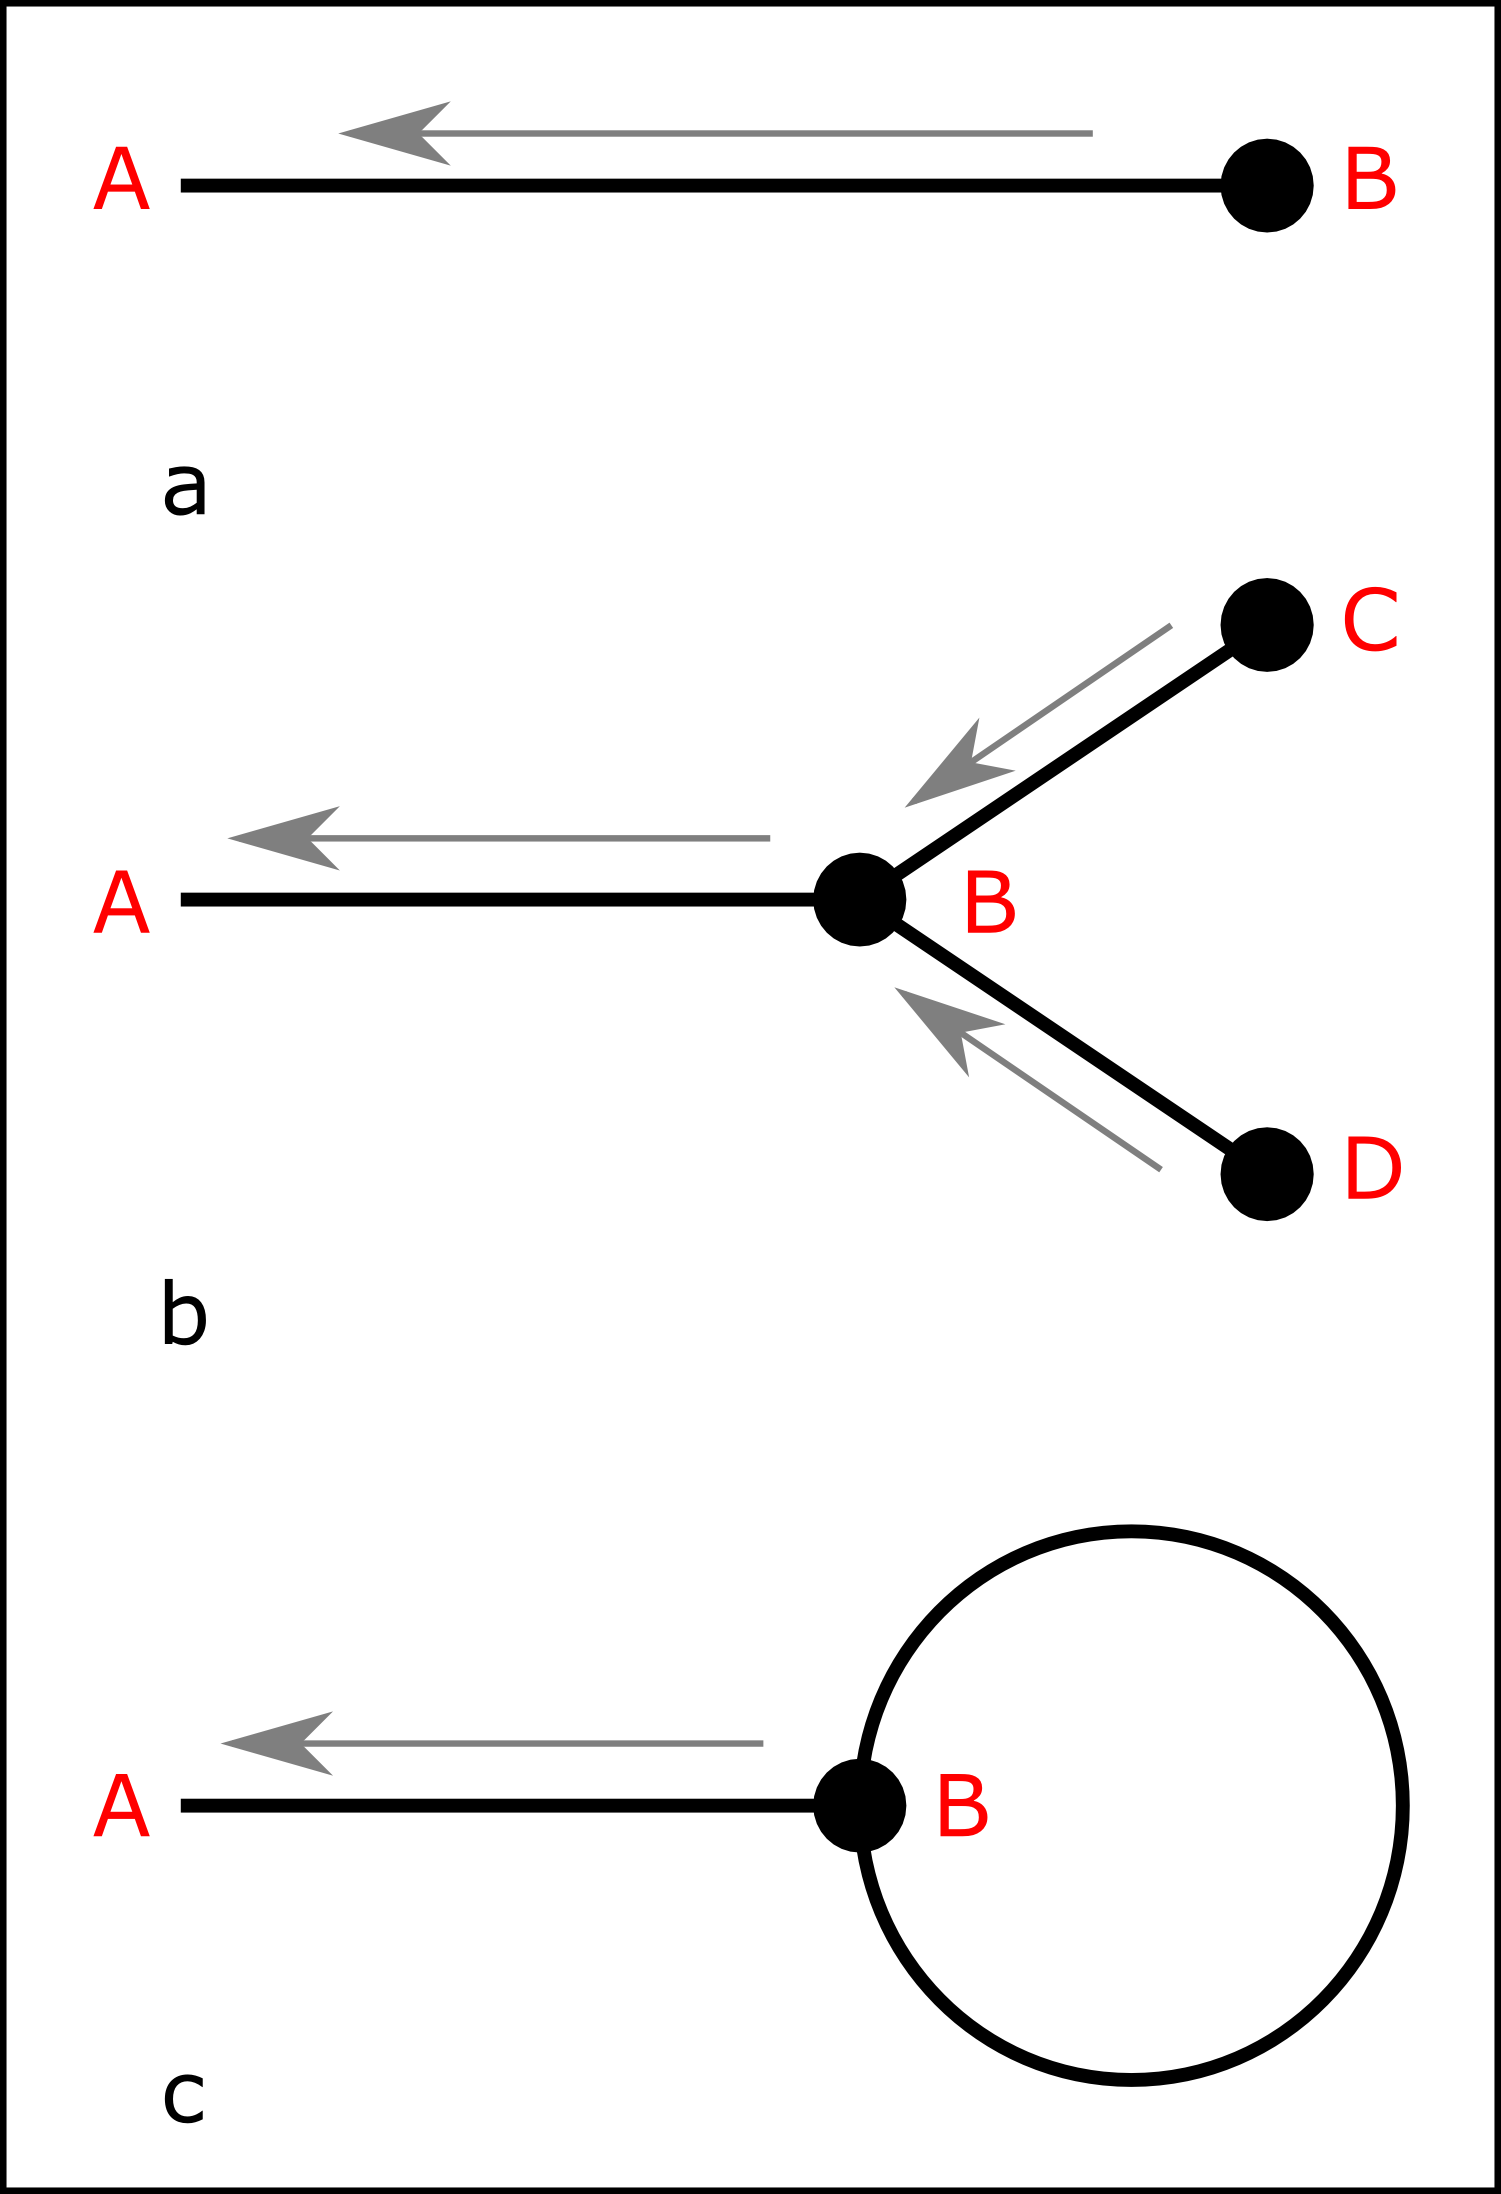
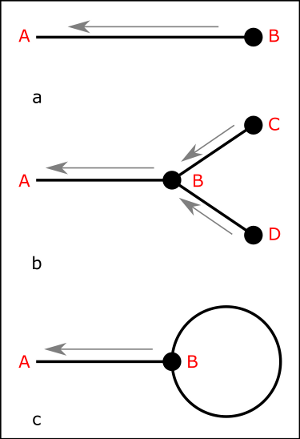
Fig. 1:
The Feynman diagrams consist of points and lines. Points at
the end of lines are so-called information sources, i.e. the
information about a point in space which is contained in the data (see
diagram (a)). Points embedded in several lines stand for data
processing steps that combine different pieces of information (see
diagram (b)). The lines describe the propagation of information: What does an
information source at position B tell me about the signal at position
A? Each of the possible diagrams describes a mathematical instruction,
an algorithm, which has to be applied to the data. The sum of the
results of the respective diagrams yields the desired answer to our
problem, e.g. the mean signal given data and previous knowledge.
|
 |
 |
|
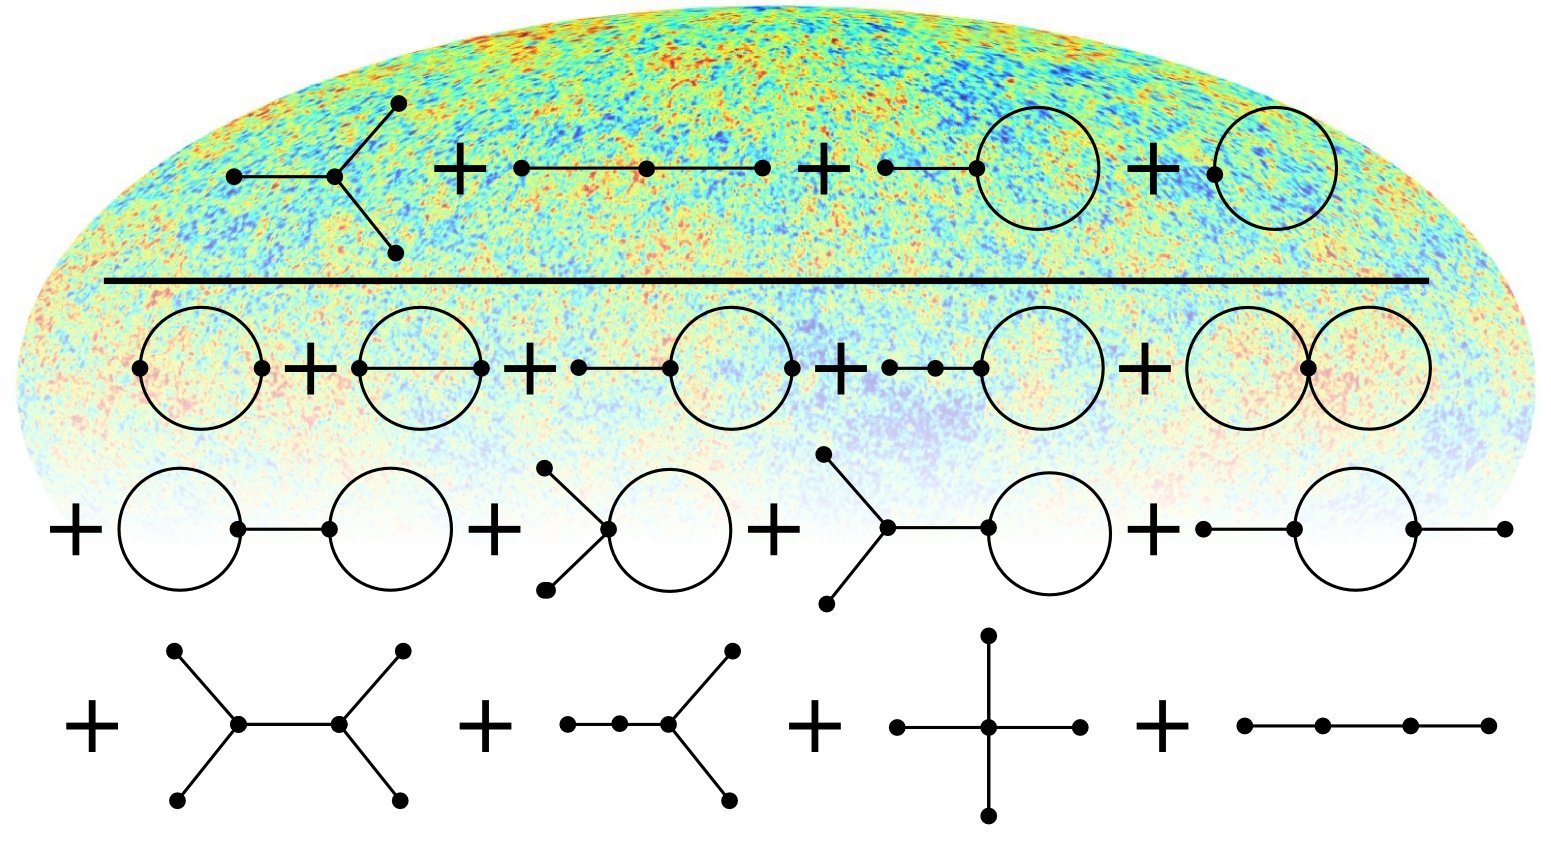
Fig. 2:
Diagrams to determine the deviation of the CMB temperature
fluctuations from a normal distribution, which is caused by inflation. The
values of the CMB temperature (here encoded in colour) have to pass
through the depicted diagrams. The temperature values of every point in
the sky are put into the end points of every diagram, and are then processed
according to the computational prescription given by the
diagram. The given combination of the diagrams yields the strength of
the statistical deviation, and thus a measurement of a
signature of inflation. The numerator of this formula, consisting of
four diagrams, is already well-known in a non-diagrammatic form in the
technical literature. The denominator, however, which encodes the
measurement uncertainty of the method, has only been known in a much
cruder form before.
|
| |
Human senses like hearing, sight, and touch allow our brain
to create a detailed image of our surroundings, even though the human
senses are by no means perfect and our field of vision is often limited.
Our brain accomplishes this by using its knowledge about the
configuration of our surroundings.
Artificial "senses" like cameras, microphones or astronomical
telescopes are also not perfect and thus need sophisticated
interpretation and
the use of additional information. For instance, cosmologists want
to precisely measure the distribution of matter in the Universe, but
they have the problem that 85 per cent of the matter is invisible.
We see the visible matter in form of galaxies, but their light is not always
caught by our telescopes. Therefore, the galaxy data only
yield an incomplete and noisy image of the cosmic matter
distribution. In this example, the signal which we want to reconstruct
from the data is the matter distribution.
Since there are a huge number of possible matter distributions, the
question is which of them is the correct signal. Unfortunately, the
same data could have been created by infinitely many different
signals. However, not all of these possibilities are equally
plausible. It is, for instance, not very likely that the cosmic matter
distribution in the region obscured by our galaxy is completely
different from the distribution in the other regions, just because
we happen to not be able to observe this region very well. After all, we
wouldn't think that a person has three legs just because we cannot
see his legs at the time we look at him. That is, we can a priori
assign a small probability to exotic signal configurations.
With this in mind, we can ask questions like: Which signal is the most
plausible one, given the data and previous knowledge? How large is the
uncertainty in this estimate of the signal?
The scientists at the Max-Planck-Institute for Astrophysics have
shown that such questions can be formulated as a statistical field
theory, the so-called Information Field Theory. The latter is very complex,
but thanks to particle physics there exist powerful mathematical tools
for handling it. We can, for instance, obtain approximate
solutions to our problems by using so-called Feynman diagrams (see
Fig. 1). These diagrams are graphical descriptions of the
data processing steps.
Not all of the resulting algorithms are entirely new. The
simplest of the diagrams (Fig. 1a) corresponds to the Wiener filter,
which has been successfully used for the last 60 years. More complex
diagrams (Figs 1b&c) can be constructed from the single steps of the
Wiener filter, and they allow us to tackle signal recognition
problems which are not optimally treated by the Wiener
filter. Here, Information Field Theory yields optimal algorithms
tailored to the respective signal recognition problem.
The first applications of this new methodology will be in the field of
cosmology. Optimal methods for cosmic cartography using galaxy
observations, which are supposed to improve existing linear methods
(see  Research Highlights October 2008),
have already been developed. Research Highlights October 2008),
have already been developed.
We can also obtain more accurate insights about the early Universe
shortly after the Big Bang using Information Field Theory.
We obtain the earliest possible map of the Universe from the cosmic
microwave background (CMB). The latter is an image of the hot gas
permeating the Universe 380,000 years after the Big Bang. It contains
information about the first fractions of a second of our
Universe, when, during the so-called 'Inflationary Epoch', space itself
was practically exploding.
The CMB can be measured by satellites like the recently launched Planck Surveyor
( Planck News).
But Planck will also measure unwanted
signals, which makes it difficult to directly interpret the data. For
example, radiation from our own galaxy blocks a part of the CMB
sky, and the detectors of the satellites produce unwanted noise in
the data. In order to detect the subtle signatures of
inflation in the temperature fluctuations in spite of these additional noise
signals, Information Field Theory has been used to derive
improved analysis techniques (Fig. 2). Planck News).
But Planck will also measure unwanted
signals, which makes it difficult to directly interpret the data. For
example, radiation from our own galaxy blocks a part of the CMB
sky, and the detectors of the satellites produce unwanted noise in
the data. In order to detect the subtle signatures of
inflation in the temperature fluctuations in spite of these additional noise
signals, Information Field Theory has been used to derive
improved analysis techniques (Fig. 2).
The utility of Information Field Theory is by no means restricted to
cosmology. Imaging techniques in medicine, geology, and material
science could possibly benefit from the theory. Should this happen,
it would be one further example of an unexpected spin-off from
fundamental research: Methods from mathematical physics, which have
been developed for computing very abstract processes in particle
physics would enter medical practices and engineering companies in
the form of software.
Torsten Enßlin, Mona Frommert
Publication
Torsten A. Enßlin, Mona Frommert, Francisco S. Kitaura,
"Information field theory for cosmological perturbation reconstruction
and non-linear signal analysis",
2008, submitted
arXiv:0806.3474
|