|
|
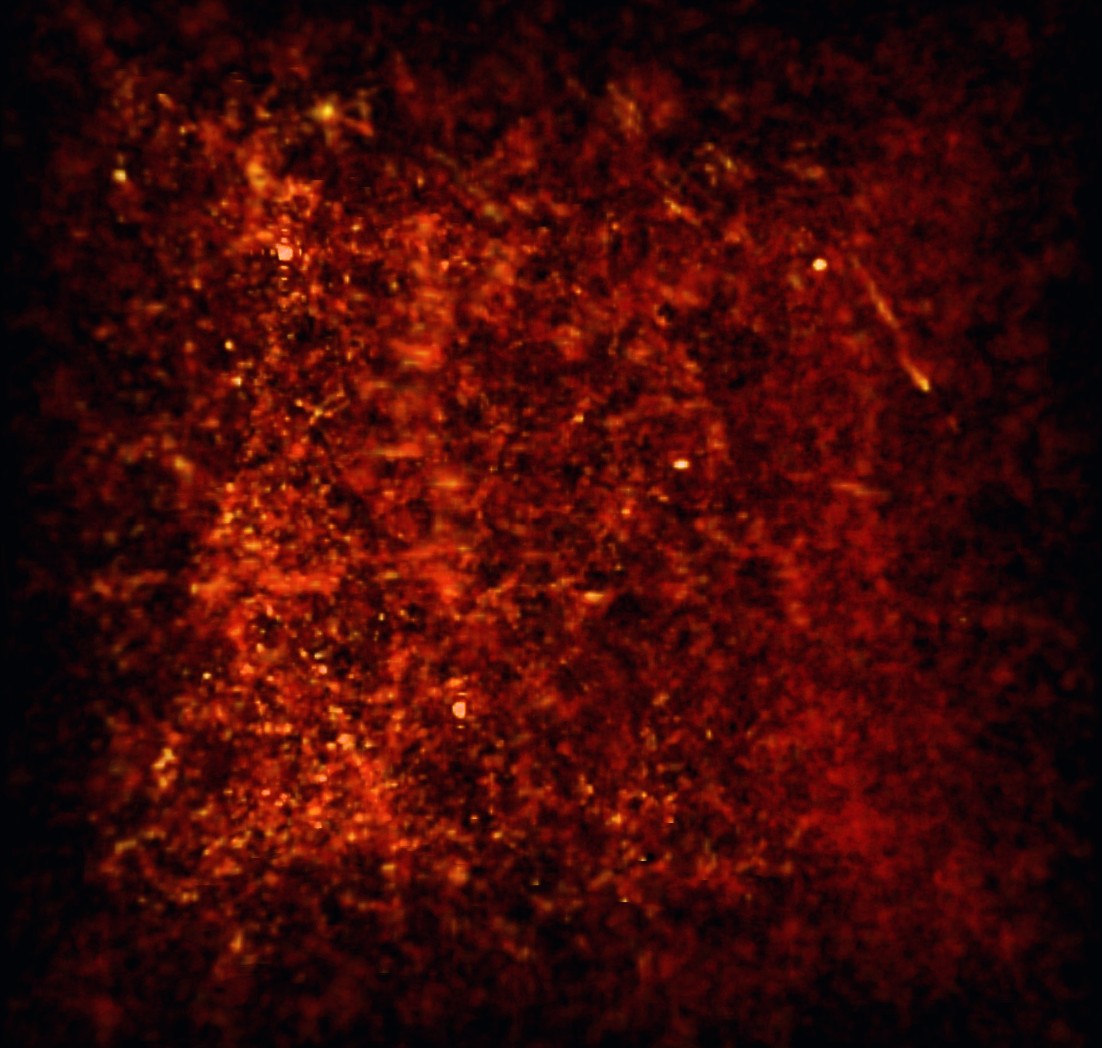
Fig. 1:
Three dimensional map of the distribution of dark matter in our cosmic
neighborhood in a cube the size of 1.5 million lightyears. The map was
computed on the basis of the sixth data release of the
Sloan-Digital-Sky-Surveys using the ARGO computer program developed at the
Max-Planck-Institute for Astrophysics.
The map is based on a few hundred thousand individual galaxies.
( Movie version) Movie version)
|
|  |
The cartography of the Universe, the cosmography, is plagued by large
white spots in contrast to the terrestrial cartography. Stars and dust
clouds of our own Galaxy obscure many views, and the dim glow of the
most distant galaxies only weakly defines the boarder areas of the
observable Universe. As the geographers of medieval times one can try
to fill in these white spots with assumptions. However, modern
cosmography does not rely on fantasies and legends with dragons and
other mythical creatures. It uses statistical methods of signal
processing and well developed mathematical theories of the emergence
and distribution of galaxies. Missing information cannot be drawn out
of a hat with these methods, however at locations with too large gaps,
stochastic methods can fill in possible cosmic landscapes, which at
least have correct statistical properties.
Maps of the Universe constructed in this way, are of great scientific
value, less for the purpose of cosmic navigation, since intergalactic
journeys even with the speed of light would require millions to
billions of years, but more to study the structure and evolution of
the Universe.
The seeds of the visible structures today were sown in a fraction of
the very first second of the Universe. In the following fourteen
billion years these structures grew constantly. They are therefore a
window into the early epochs of the universe, shortly after the big
bang, when space was filled with radiation and hot plasma and there
were neither stars nor galaxies. An analysis of these structures
reveals properties of cosmic matter, gravitation, which is responsible
for the structure growths and the geometrical properties of space-time
of the Universe. Good cosmic maps permit further detailed predictions
of a number of observable effects. Comparing them to real observations
may verify our understanding of space, time and matter.
The construction of such maps was so far a huge computational problem, since
in principle each galaxy
brings a bit of
information for each of the millions of positions of the reconstructed
Universe. Earlier attempts to construct such maps required enormous
computations on supercomputers, but delivered only maps with moderate
resolution. Jens Jasche and Francisco S. Kitaura of the cosmography
team at MPA have developed ARGO
(Algorithm to Reconstruct Galaxy-traced Overdensities),
a computer program, which is able to generate within
an hour on an ordinary personal computer three dimensional maps with,
compared to earlier works, significantly increased resolution. Cheng
Li, also of the cosmography team at MPA, and Francisco S. Kitaura
have prepared data from the Sloan-Digital-Sky-Survey for the data
processing. Thus the team of scientists succeeded at calculating the
probably most detailed map of the Universe ever. It shows the
distribution of dark matter in a cube the size of a 1.5 billion
light-years in our cosmic neighborhood.
The high speed with which ARGO generates maps will in future permit us
to combine the steadily growing number of measured galaxies into a
common, high-resolution chart of the visible Universe. Simultaneously,
any existing uncertainties due to measurement inaccuracies will be
characterized precisely. Thereby, the maps become applicable for solid
scientific purposes.
For example, Torsten Enßlin,
who initiated the cosmography project,
is planning
to use such maps for predictions of the
temperature fluctutations of the cosmic microwave background
radiation, which are generated by the rip-off of matter structures in
the accelerated expanding Universe today. Presumably in 2009, the
Planck-Surveyor satellite mission will accurately measure such
fluctuations. The observations can then be compared to the
predictions, permitting us to measure the rate of cosmic acceleration
more precisely.
Although the cosmographic maps are meant for pure scientific purposes,
in the unlikely case that a traveler wants to use them to navigate
through the Universe, the cosmography team wishes him a comfortable
journey for the next million years.
Franciso S. Kitaura, Jens Jasche, Cheng Li, Torsten A. Enßlin
Further Members of the Cosmography Team:
Ben Metcalf, Gerard Lemson, Benjamin D. Wandelt, Jérémy Blaizot
Involved Institutions:
Max-Planck-Institut für Astrophysik, Garching (JJ, FSK, CL, TAE, SDMW, JB, BM)
Max-Planck-Institut für Extraterrestische Physik, Garching (GL)
Scuola Internazionale Superiore di Studi Avanzati di Trieste (FSK)
Université de Lyon (JB)
University of Illinois at Urbana-Champaign (BDW)
Publications
The cosmographic map is based on the method described in
F.S. Kitaura and T.A. Enßlin,
"Bayesian reconstruction of the cosmological
large-scale structure: methodology, inverse algorithms and numerical
optimization", 2008,
 Monthly Notices of the Royal Astronomical Society
Volume 389, Issue 2, pp. 497-544.
Monthly Notices of the Royal Astronomical Society
Volume 389, Issue 2, pp. 497-544.
|