 |
|
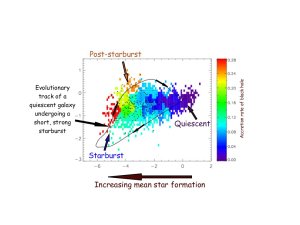
Fig. 1:
A statistical
analysis of the spectra of galaxy bulges have provided astronomers
with new parameters which quantify the recent star formation history
of galaxies. The different regions of the diagram are inhabited by
galaxies with different star formation histories as labelled. Here the
regions of the diagram have been colour coded according to the rate of
accretion of the black hole at the center of the galaxy. Red is strong
accretion and purple is weak accretion. The black points indicate the
position of galaxies with the highest black hole accretion rates,
which noticeably do not all lie in the starburst/post-starburst region of
the diagram.
|
 |
 |
|
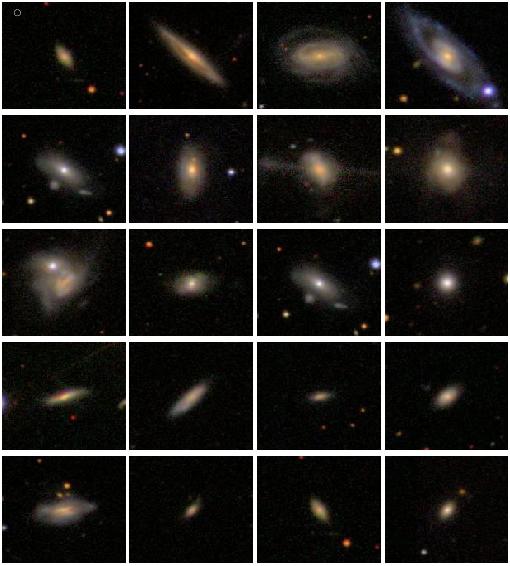
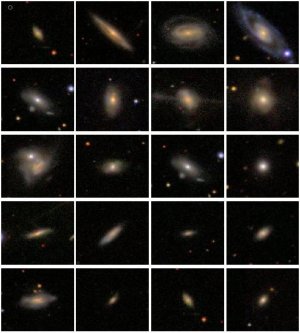
Fig. 2:
Sloan Digital Sky Survey images of
a sample of the galaxies identified by the scientists as having
experienced a recent strong burst of star formation in their central
bulge. Notice the streams of stars around the main galaxy, dust lanes,
and lopsidedness of the galaxy in some images: signs of a recent
gravitational disruption probably through an encounter with another
galaxy. The images are 1' square, and the circle in the top left shows
the size over which the spectra are taken, and therefore the size in
which the star formation histories are derived.
|
| |
It is now believed that at the center of every massive
galaxy in the local Universe resides a supermassive Black
Hole. Observationally it has been determined that this Black Hole
makes up about 0.1% of the bulge mass, regardless of the size of the
galaxy
( Research Highlight April 2005).
There are many theories to
explain this correlation, from the rapid build up of all the black
hole and bulge mass early on in the life of the galaxy, to a gradual
build up of both through slow accretion of gas into the bulge of the
galaxy tto fuel both star formation and subsequently the black hole
(
Research Highlight February 2005).
Research Highlight April 2005).
There are many theories to
explain this correlation, from the rapid build up of all the black
hole and bulge mass early on in the life of the galaxy, to a gradual
build up of both through slow accretion of gas into the bulge of the
galaxy tto fuel both star formation and subsequently the black hole
(
Research Highlight February 2005).
The observational indication of a growing black hole comes in the form
of high excitation lines emitted from ions in the gas surrounding the
black hole (seyferts and liners), or scattered light directly from the
accretion disk feeding the black hole (quasar). These objects are
called Active Galactic Nuclei (AGN). In particular, in the optical
wavelength range, the [OIII] emission line gives a good estimate of
the black hole growth rate
(
Research Highlight July 2004).
In order to
combine this information on the black hole growth with the recent star
formation history of galaxies, Vivienne Wild, Guinevere Kauffmann and
Tim Heckman (Johns Hopkins University, USA) developed a new method
based on a principal component analysis (PCA) of the galaxy
spectra. By combining information from all the pixels in the galaxy
spectrum, this method allows useful information to be derived from
spectra of much lower quality than with previous methods.
Using their new method, the scientists determined the recent star
formation history of ~33,000 low redshift bulge-dominated galaxies
from the Sloan Digital Sky Survey (SDSS). Because these galaxies are
near by, the spectra obtained for them only cover their centers, and
thus the recent star formation history derived for them applies only
to the bulge of the galaxy. The scientists found that the galaxy
bulges could be classified into three main groups: (1) Those that have
no sign of any recent star formation (55%); (2) Those that have
undergone a recent burst of star formation, where the mass of stars
formed in the burst is greater than ~1% of the bulge mass (4%); (3)
Those that have some ongoing star formation, but no signs of a strong
recent or ongoing starburst (39%). They also found that although
almost half of the AGN are found in bulges in the 1st class, with no
sign of recent associated star formation, the black holes in these
bulges are growing only extremely slowly. In fact the majority of
black hole growth in the local Universe (>60%) is coming from black
holes hosted by bulges in the 3rd class - with some ongoing star
formation, but no evidence for spectacular recent or ongoing
starbursts. This contradicts recent theories that the mechanism
responsible for concurrent black hole and bulge mass growth is through
massive mergers of galaxies and rapid build up of both.
However, the 4% of bulges which were identified as having undergone a
recent strong burst of star formation, do show signs of a recent
disturbance - tidal tails, excess "lopsidedness" in their light
distribution and the older bursts are hosted by compacter
galaxies. These bulges are more than twice as likely to host black
holes which are accreting very strongly than those galaxies with
ordinary levels of star formation.
Vivienne Wild
Publication
Vivienne Wild, Guinevere Kauffmann, Tim Heckman, Stephane Charlot, Gerard
Lemson, Jarle Brinchmann, Tim Reichard, Anna Pasquali,
"Bursty Stellar populations and obscured AGN in galaxy bulges",
Mon. Not. R. Astron. Soc., accepted, (2007)
 arXiv0706.3113 arXiv0706.3113
|