|
|  |
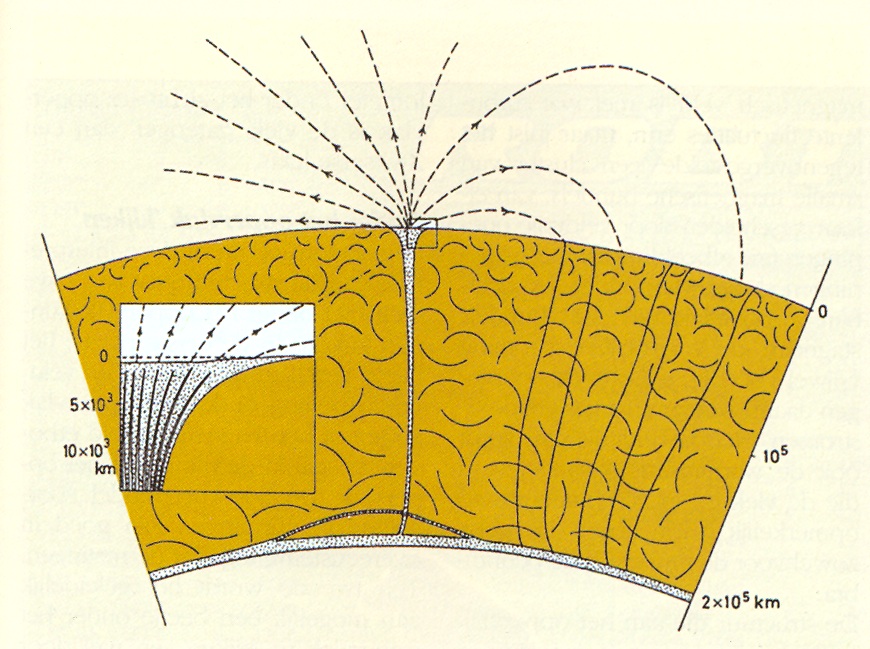
The dark patches on the solar surface called sunspots are magnetic:
magnetic field lines cross the surface from below and extend up into
the atmosphere (Fig 2). The presence of these field lines somehow
causes a remarkably complex structure: dark and bright dots and
filaments, all of them in motion in various directions (Fig 3). What
does all this activity mean? The puzzle has now been deciphered with
the aid of numerical simulations, which confirm a
 theoretical model
proposed earlier. theoretical model
proposed earlier.
The patch we observe as a spot is not something 'painted on the
surface' of the Sun. It is only a thin 2-dimensional slice through an
extended 3-dimensional structure. If we could dig below the surface
and look at its roots, we might get a better idea of what causes this
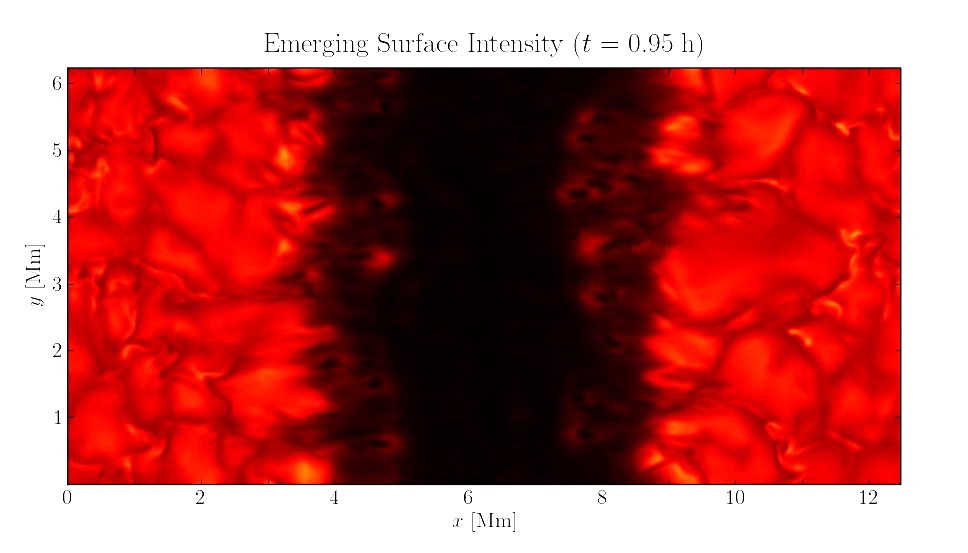
complex looking structure. This is now becoming possible: with
realistic numerical simulations. The first successful simulation of
this kind is shown in Fig 1. It shows the computed brightness as it
would be observed at the surface in a real sunspot. The spot simulated
(actually a strip) is still rather small compared with typical
well-developed spots, but its properties are already remarkably
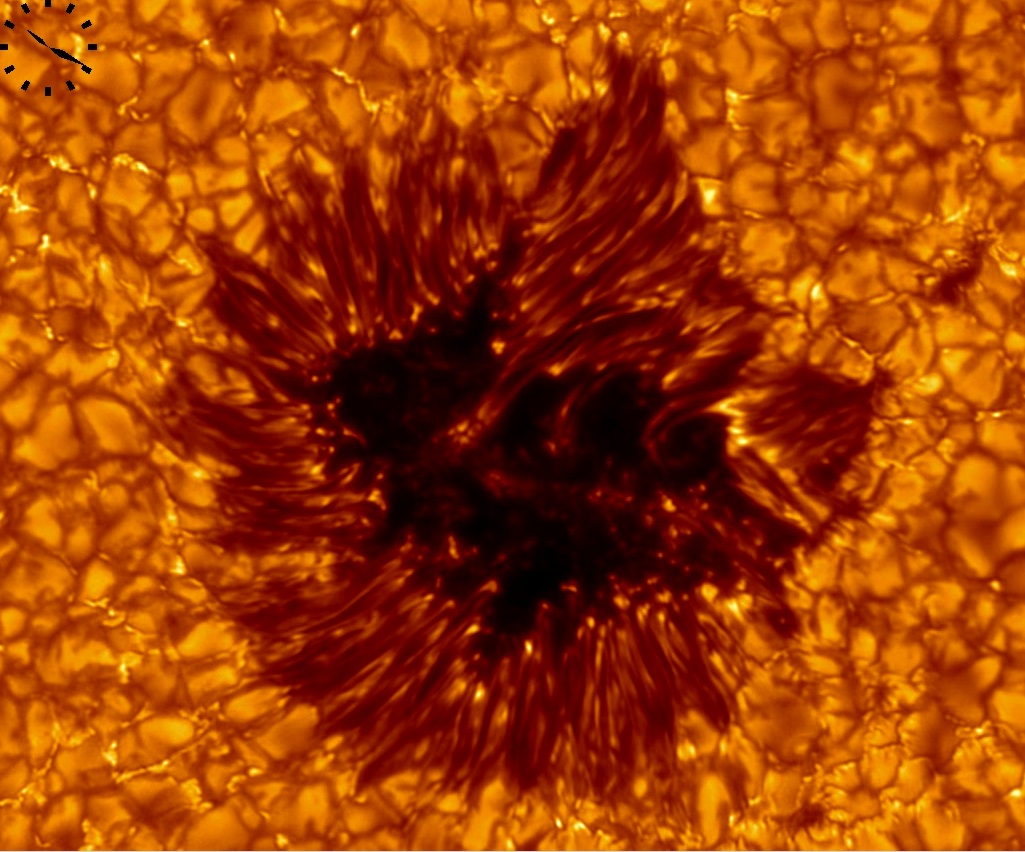
similar to the real thing. Compare them with Fig 3: the 'fingers'
penetrating into the spot behave just like the structure seen around
the dark central part (the 'umbra') of a real spot. They move in the
same way, have the same bright 'head' and dark stripe over the
tail. Like the real filaments, they often leave a longer-lived bright
dot in the umbra where they fade away. A number of other details also
fit very well, for example the pattern of outward motion seen in the
granulation around the spot, and the changing appearance of the spot
as it approaches the limb of the Sun. What does not fit well is the
length of the filaments: they are much shorter than the long penumbral
filaments seen in Fig. 3. This was to be expected, however: observed
spots as small as the one calculated usually do not have such well
developed penumbral filaments either. They are expected to show up in
larger (more expensive) simulations.
What do we see below the surface, in these simulations? What is bright
at the surface corresponds to a gap in the magnetic field below, which
closes around the observed surface. In these gaps, the gas is in
convective motion just like in the granulation around the
spot. Between the gaps, the magnetic field is strong and suppress
these motions, causing a darkening at the surface. This confirms
earlier
predictions
of this structure.
The key to the success of these simulations lies in the word
`realistic'. The fluid flows and the magnetic field have to be
computed in a realistic model of the Sun. Critical, for example, is
the correct inclusion of the steep drop in pressure from the interior
to the vacuum outside, and of the radiation emitted from the
surface. This realism is also possible: the physics of the solar
plasma is known in detail, and the required numerical calculations
have become possible with the present generation of computers.
Tobias Heinemann, Åke Nordlund, Göran Scharmer, Henk Spruit
Publications
Heinemann, T., Nordlund, Å., Scharmer, G., Spruit, H.C.
"MHD simulations of penumbra fine structure"
 Astrophysical Journal 669 (2007), 1390
|