|
|  |
New computer models to simulate Type Ia Supernova explosions are
currently leading to a breakthrough in this field. Friedrich Röpke
and Wolfgang Hillebrandt from MPA recently presented new results of
a three dimensional thermonuclear explosion simulation leading to
the complete disruption of a White Dwarf. The White Dwarf originally
contained mostly Carbon and Oxygen. These atomic nuclei are
converted into heavier elements — up to Nickel and Iron — during
the violent explosion. Only a few seconds after the ignition the
thermonuclear fusion is finished, and the Supernova ejecta expand
homologously, i.e. with a constant velocity whose value is
proportional to the distance from the center of the Supernova. The
efficiency of the nuclear fusion depends on the conditions of the
environment, such as temperature and density, so that the
determination of the chemical abundances of the Supernova ejecta
allows us to draw conclusions on the processes that lead to the
explosion.
Therefore, extensive observations of nearby Supernovae are also
necessary. The observational campaign is part of the "Research
Training Network" (RTN) The Physics of Type Ia Supernovae,
funded by the European Union. On the one hand these data are used to
analyze the physical properties of Type Ia Supernovae from the
observational point of view. On the other hand explosion models can
be tested by means of the observations. Synthetic spectra play a key
role in this context. In particular by reconstructing the chemical
abundances layer by layer, explosion models can be checked
quantitatively for the very first time.
This method is based on the computational simulation of a series of
spectra obtained in steps of a few days between the explosion and
about one year later. For each of these epochs, a
"photosphere" is defined, above which the ejecta is mostly
transparent ("optically thin") whereas the photons below
this layer are trapped due to the high optical depth. The photosphere
moves inwards with time, i.e. towards lower velocities, due to the
expansion of the Supernova until a few weeks after maximum light the
photosphere eventually disappears and the Supernova ejecta become
completely transparent.
Chemical abundances above the photosphere of the earliest spectrum
in the series are derived from the corresponding model. They are
stored for further calculations. Only the abundances in the layer
between the first and the second photosphere are determined through
the next synthetic spectrum in the time sequence. Continuing this
procedure throughout the entire set of available spectra delivers a
detailed abundance stratification of the Supernova ejecta. This
result can easily be compared with theoretical predictions from the
explosion models.
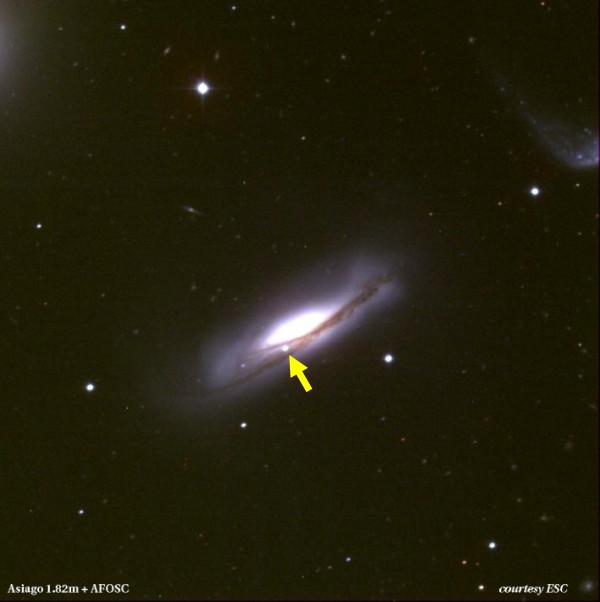
Supernova SN 2002bo (Fig. 1) is perfectly suited for this kind of
analysis because a good time series of observations, with spectra
taken almost every other night, between about 13 days before
maximum light and about 10 days after, together with two observed
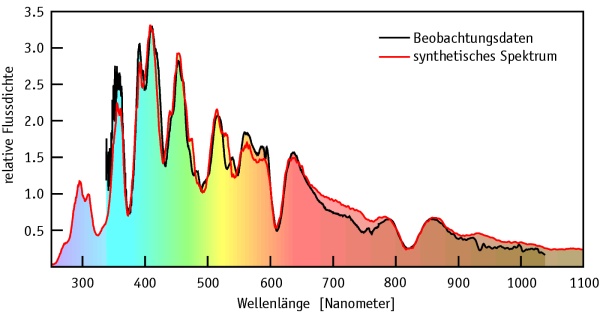
spectra in the so-called nebular phase, were obtained. Figure 2
shows an observed spectrum near the maximum of optical light (in
black) together with the corresponding model (in red) as an example
for the 13 synthetic spectra that were calculated. The observed
spectra cover wavelengths from the ultraviolet to the near infrared.
Since the chemical ingredients in the synthetic spectrum are well
known, the abundances can be derived from the absorption lines and
their depths.
The analysis of all synthetic spectra delivers the abundances of all
chemical elements in the Supernova ejecta against expansion velocity
(Fig. 3). Most obvious is the distribution of heavy nuclei near the
center of the Supernova (Iron, Nickel, Titanium, and Chromium)
followed by the intermediate mass elements (IME) (Silicon, Calcium,
Magnesium) at larger radii. Unburned material (mainly Oxygen) is
located in the outermost parts of the ejecta. However, the
individual layers are not completely separated, but clearly overlap.
This effect is a consequence of the explosion mechanism where the
different zones are mixed during the burning process. If mixing was
ignored the spectra could not be modeled with such high quality.
Meanwhile there are many indications that mixing is not a global
effect but a local phenomenon in the Supernova ejecta. This
substantiates the three dimensional character of the Supernova
explosions. The spectra, and therefore also the chemical abundances,
should look slightly different depending on the viewing angle to the
Supernova.
In order to draw more detailed conclusions on the accuracy of the
explosion models it is necessary to determine absolute abundances
and their exact distribution. It is of particular interest to know
about the amount and distribution of radioactive 56Ni, as this
affects the explosion energy as well as the maximum luminosity.
These questions will soon be answered when a larger sample of
individual Supernovae will be analyzed in the same way as SN 2002bo.
Further steps towards obtaining a complete picture of these objects
will be made through computer models which simulate spectra in three
dimensions. With this knowledge the uncertainties in measuring
distances with Type Ia Supernovae can be reduced significantly, and
cosmological consequences will be confirmed properly.
M. Stehle, P.A. Mazzali, W. Hillebrandt
Further information:
M. Stehle, P.A. Mazzali, S. Benetti, W. Hillebrandt, Abundance
stratification in Type Ia Supernovae: I. The case of SN 2002bo,
2005, MNRAS, 360, 1231
|