The data provided here contains stellar mass estimates using fits to the photometry. It is well known that this is acceptable to get mass estimates, but they differ somewhat from the masses obtained using the Kauffman et al (2003) methodology which uses spectral features (D4000 & HdA in the case of K03 and a total of five indices in the case of Gallazzi et al 2005).
This page is therefore dedicated to a comparison of these different mass estimates - the bottom line is that they agree very well although there are some minor offsets. The largest is due to aperture corrections and changing M/L with radius in galaxies.
The fits are in both cases made to a large grid of models from BC03 spanning a large range in star formation histories. For each model a likelihood is calculated from χ2. The likelihood of all models is then marginalised onto the mass axis and a likelihood distribution for the mass is obtained. However they differ slightly in detail because they use different information.
These fits uses spectroscopic features. These are obviously measured from the spectrum and the M/L estimated from a fit to these features is therefore only truly representative for the region sampled by the fibre and a constant M/L must then be assumed to get a total mass.
These are very similar to the index fits but instead of spectral features the broad-band u,g,r,i,z photometry of the SDSS is used for the fits. These magnitudes are corrected for emission lines by assuming that the relative contribution of emission lines to the broad-band magnitudes is the same inside the fibre as outside. This is significantly less restrictive than other assumptions but is unlikely to be entirely correct. However the effect of emission lines on broad-band magnitudes is very minor (typically < 0.1 magnitude) so can usually be ignored.
These mass estimates are obtained both through fits to the SDSS fibre photometry and the total (ModelMag) photometry. Since the former refer to the region sampled by the fibre these should be directly comparable to the index fits. However these fits are not normalised to the total magnitudes so this must be adjusted afterwards. In contrast the fits to the total magnitudes directly give the total masses.
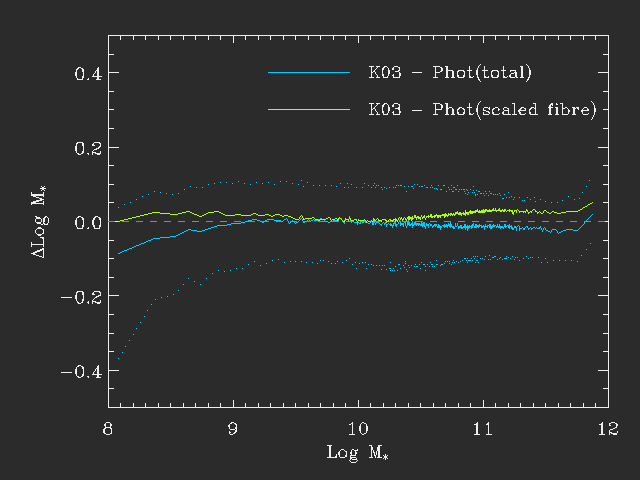
The first check is how the different mass estimates compare.
This figure shows a comparison for DR4 data. The x-axis shows the stellar mass from Guinevere's modelling (Kauffmann et al 2003, K03). The y-axis shows the median difference between the K03 mass estimates and those obtained from fitting to the total magnitudes (blue) and to the fibre magnitudes scaled to total (green-ish).
It is clear that the different mass estimates compare quite well throughout - the median offset is -0.01 for the blue line and 0.01 for the green line. The dotted blue line shows the 68% spread.
There is however a significant offset at low masses. This appears to be because for these nearby systems there is a tendency for the spectra to be placed on bright spots - typically H II regions and hence the fits based on the spectra will tend to have a lower M/L and hence (for a fixed total magnitude) a lower mass. This is exactly the trend seen at low mass. It is likely that the photometric fits are more accurate here but either is likely to be significantly uncertain.
Finally it is very reasonable to ask whether one method is better than the other. In general one would expect the fits to indices to perform slightly better because it isolates specific regions of the spectrum. However this is tempered by the fact that indices are more sensitive to emission line contamination.
The following figure shows the median uncertainty on the mass estimates as a function of stellar mass.
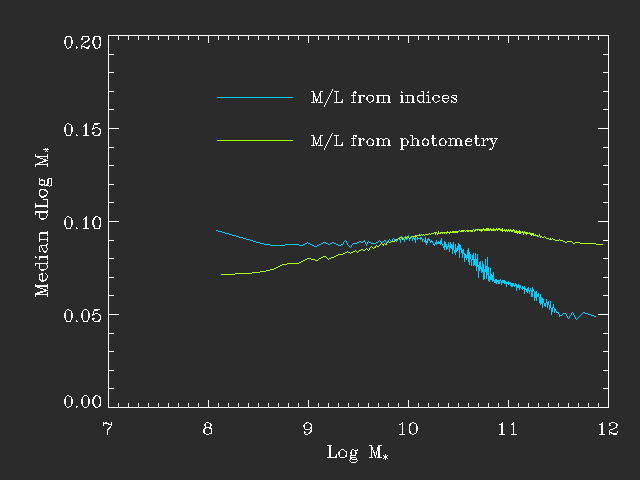
As can be seen here the formal error shows different trends with mass for the two methods. The fits to the photometry are somewhat more constrained at low mass - this is exactly because the emission line contribution makes the index fits less well-constrained. However at higher mass the increased power of the indices is clear and the PDF is almost twice as broad for fits to the photometry than those to indices. Of course systematic uncertainties are large so this might be somewhat immaterial.