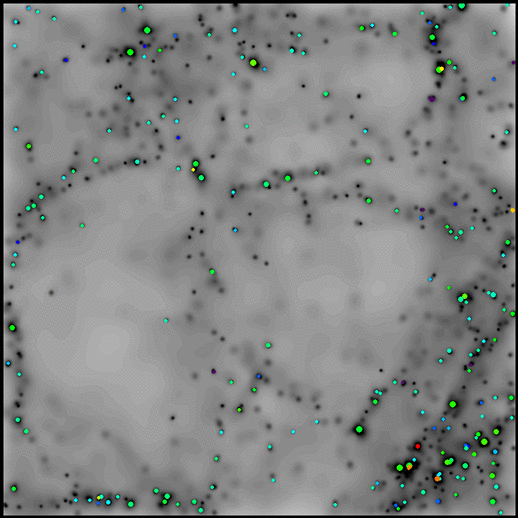
| Voids in the Simulated Local Universe |
H. Mathis and S. D. M. White

Introduction/ High resolution Figure 1 for astro-ph/0201193/ Zoom out : 50 Mpc/h wide and 15 Mpc/h thick region centred on Figure 1/ Nearest neighbour statistics with denser reference sample/ Test galaxy and halo populations/ links/
The next plots illustrate the effect of using a denser set of reference
galaxies (new sample, with relaxed selection criteria) on the
nearest neighbour statistics compared to the results obtained using the
astro-ph/0201193
sample (initial sample). Recall that we are computing all statistics in real space.
Click the plots to view them in full extent
(corresponding .ps.tar.gz files can then be downloaded).
In this case, the measured 10% increase in the ratio
Dto/Doo proves that the effect is quite
limited and does not change our conclusions that GL1
does not constitute a homogeneous population with respect to the new
reference objects. We stress that the new reference sample has 20
times more objects.
Last modified: Feb 11, 2002. For Questions / Comments / Remarks : hmathis@mpa-garching.mpg.de
INTRODUCTION
We use simulations of the formation and evolution of the galaxy
population in the Local Universe to address the
issue of whether the standard theoretical model succeeds
in producing empty regions as large and as dark as the observed
nearby ones. We follow the formation of galaxies in an LCDM universe
and work with mock catalogues which can resolve the morphology of LMC
sized galaxies, and the luminosity of objects 6 times fainter. We
look for a void signature in sets of virialized haloes selected by
mass, as well as in mock galaxy samples selected according to observationally
relevant quantities, like luminosity, colour, or morphology.
We find several void regions with diameter 10 Mpc/h in the
simulation where gravity seems to have swept away even the smallest
haloes we were able to track. We probe the environment density of
the various populations and compute luminosity functions for
galaxies residing in underdense, mean density and overdense
regions. We also use nearest neighbour statistics to check
possible void populations, taking L* spirals
as reference neighbours. Down to our resolution limits,
we find that all types of galaxies
avoid the same regions, and that no class appears to populate the voids
defined by the bright galaxies.
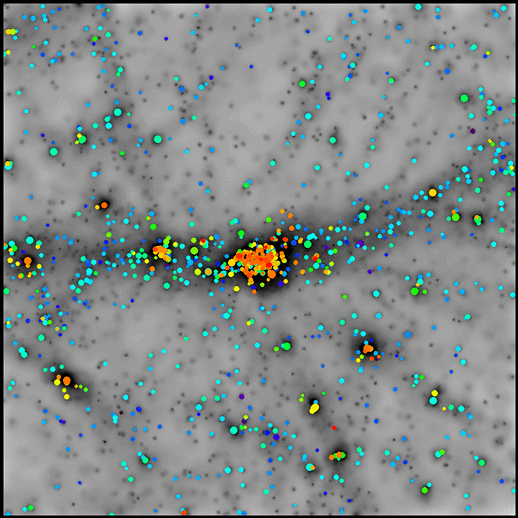
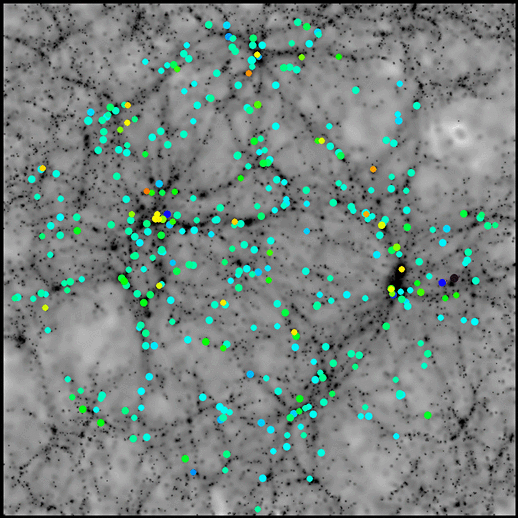
High resolution Figure 1 (3 images) for astro-ph/0201193
In the Void region and the Virgo cluster, we show all galaxies down to
MB=-16.3 and MB=-17 respectively. The latter is
limited to avoid saturating the cluster region.
In the slice extracted from the "full simulation"
(thickness 30 Mpc/h in the SGZ direction and centred on the SG plane),
we only plot reference, L* spiral galaxies.
The colour and size of the symbols scale with the B-V index and the
B-band luminosity of the galaxies.

Format
Void region
Virgo cluster
Full simulation (reference galaxies only)
eps
Void (165 kB)
Virgo (261 kB)
Full Simulation (418 kB)
gif
Void (150 kB)
Virgo (315 kB)
Full Simulation (315 kB)
Zoom out : 50 Mpc/h wide and 15 Mpc/h thick region centred on Figure 1
Click on the pictures to expand the image to full size : 1024x1024
pixels, in gif format. Note that the top right corners of the pictures
extend to the low-resolution region of the simulation where we did not
follow galaxy formation.
We caution that although we show the same galaxy population beyond the
luminosity resolution limit as before, the colour scale for the symbols used in
the following pictures has been modified with respect to the
one used in the preprint, for better rendering of the population in
the wider slice. We also provide below with a picture of the
galaxy distribution in the 24 Mp/h cubic region discussed so far in
that new colour scale, for meaningful comparison :
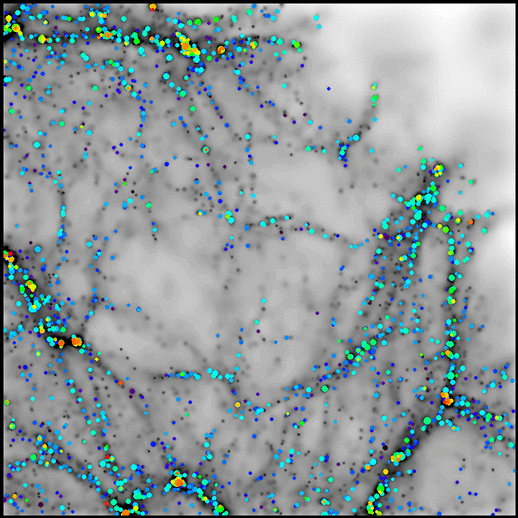
Dark matter and galaxies brighter than the luminosity resolution
limit (MB=-16.3) in a slice of thickness 15 Mpc/h and width 50 Mpc/h
encompassing the SG plane and projected along SGZ. The slice is centred on the "void" shown
in Section 2 of astro-ph/0201193.
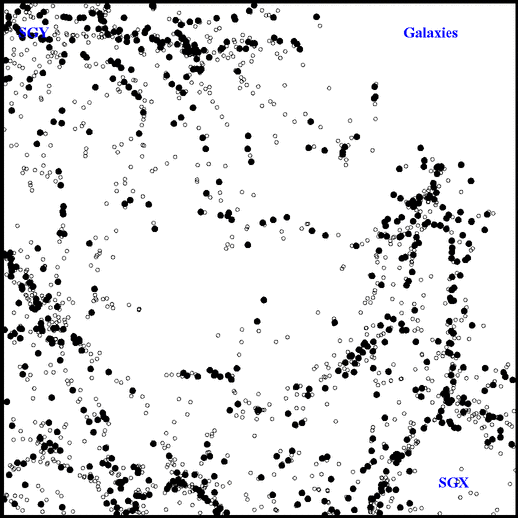
Distribution of the 70% least luminous galaxies brighter than the
luminosity resolution limit in the same slice as above (open
circles) compared to the distribution of the remaining most
luminous objects (filled symbols).

Distribution of galaxies in the 24 Mpc/h cube considered in Section 2 of
astro-ph/0201193,
but with a symbol colour scale similar to that used for the picture
above (50x50x15 Mpc/h slice). Compare this image with the one below the title.
Probing the effect of the density of reference galaxies on nearest neighbour statistics
We now focus on the samples associated with the two outermost galaxy
property bins : samples #1 and #7, with the
exception of the 6th "halo mass" sample for reasons of
noise. We also plot the result of randomizing within the simulation
the positions of one third of the test objects.
TEST POPULATIONS
Download
the (galaxy and halo) void test populations.
LINKS