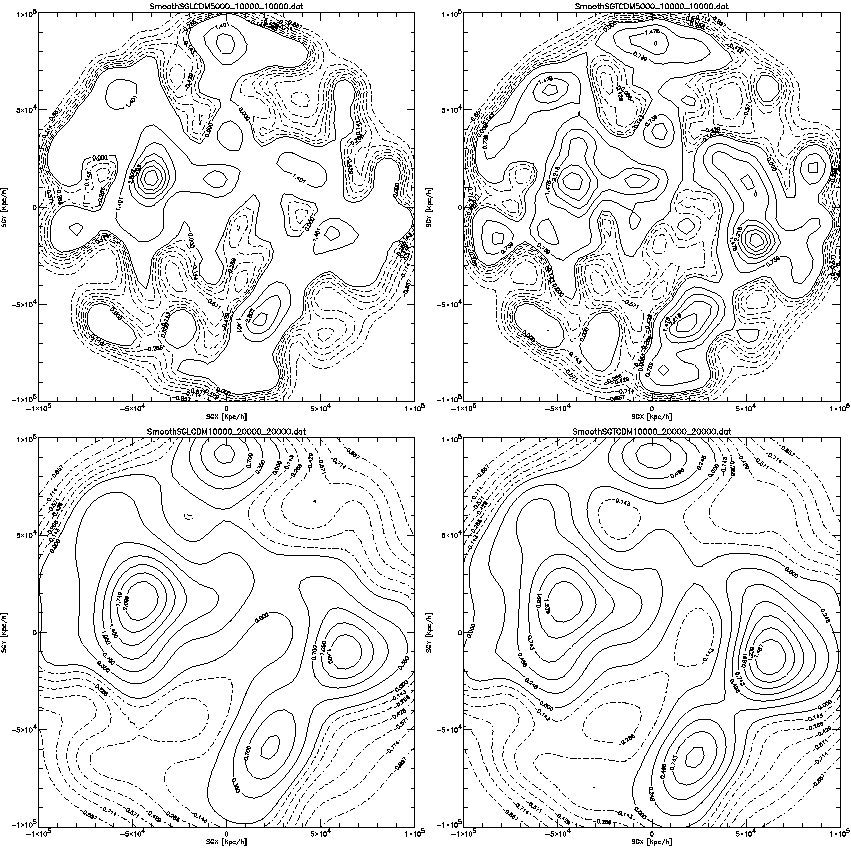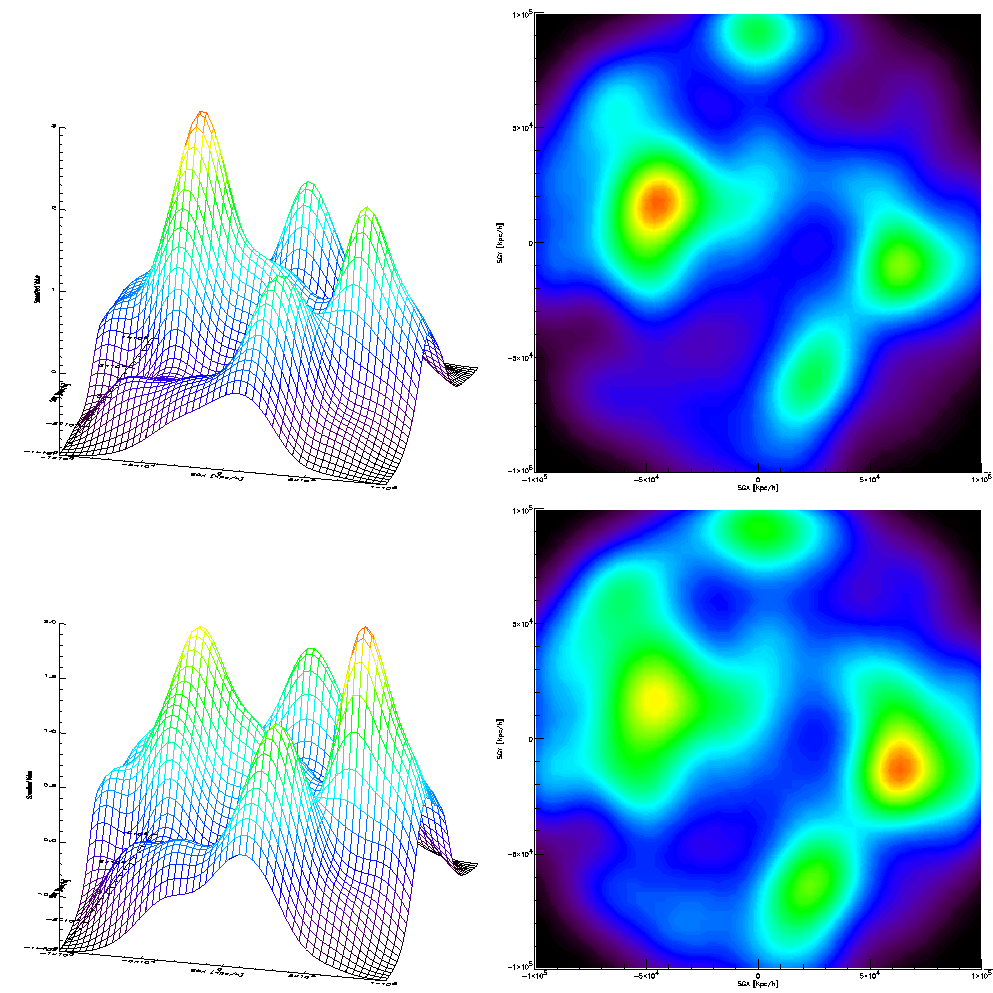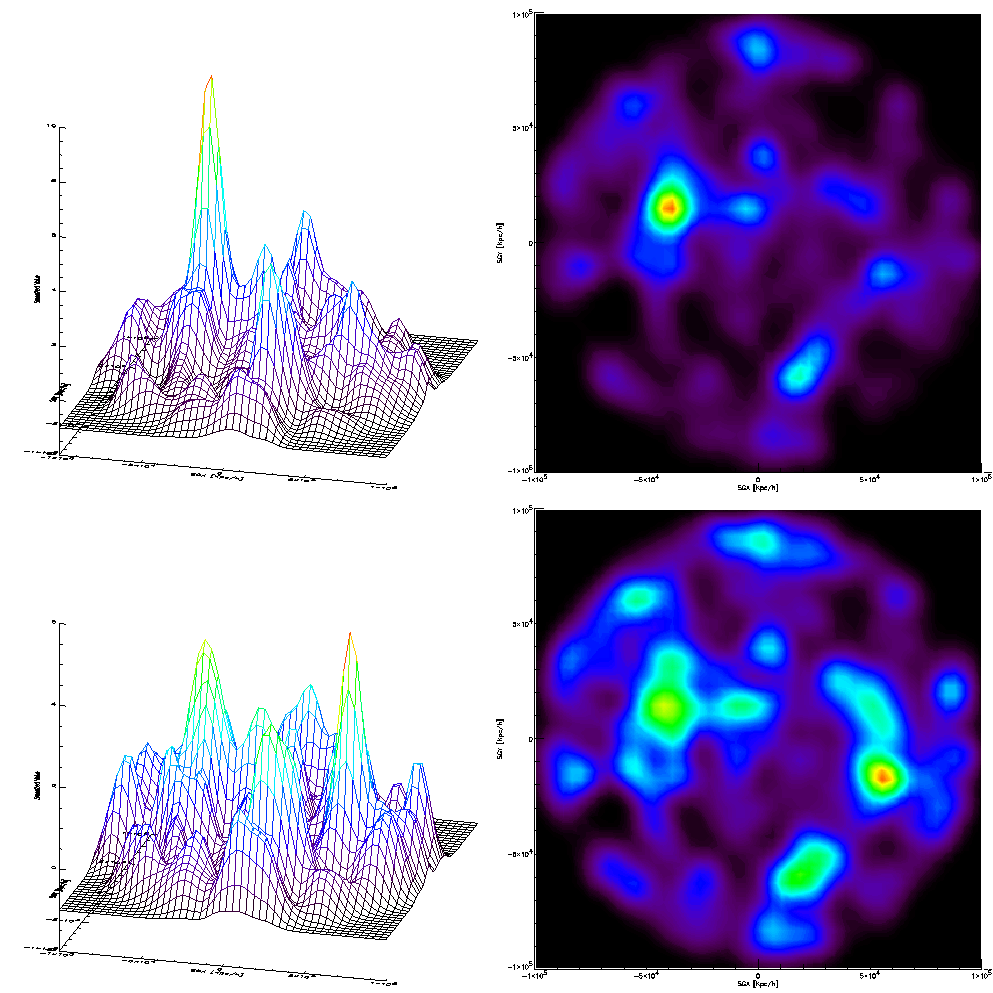
TCDM model at right, LCDM at left.
Smoothing radius of 5Mpc/h at top, 10Mpc/h bottom
The selected slice is [-50., 50.] Mpc/h in SGX & SGY
Overdense contours are full lines, underdense dash-dotted lines, labels
display the overdensity / mean smoothing value over the selected region.

Same data as before, now LCDM is at top, TCDM at the bottom.


 Back to the Galaxy Formation Group at MPA
Last modified: Feb 15, 2000. For Questions / Comments / Remarks : hmathis@mpa-garching.mpg.de