 |
|
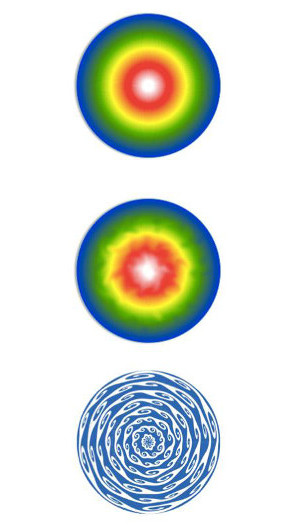
Fig 1:
Schematic illustration of gas density distribution in a spherically symmetric
cluster in perfect hydrostatic equilibrium (v=0, top) and in a slightly
disturbed cluster (v ≠ 0, middle). Slow large-scale perturbations in a
stratified cluster atmosphere can be interpreted as internal waves (as
illustrated in the bottom panel), similar to waves in the ocean, where the
velocity of water and the amplitude of waves are linked. In clusters, similar
perturbations are caused by a variety of reasons, including minor mergers or
the activity of the central supermassive black holes.
|
 |
 |
|
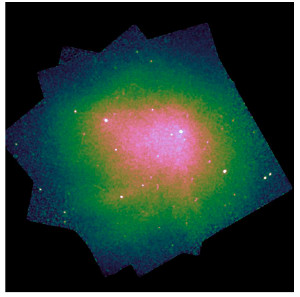
Fig 2:
X-ray image of the Coma cluster as seen with Chandra observatory. The
substructure seen in the image implies that the X-ray emitting gas is not at
rest.
|
|  |
Galaxy clusters are the largest gravitationally bound structures in the present
Universe. Hot gas (with temperatures of 10 to 100 million Kelvin) fills their
gravitational potential wells and shines in the X-ray band, making the clusters
an easy target for orbital X-ray observatories. Both the density and the
temperature of the gas in clusters is routinely measured using X-ray data,
while it is notoriously difficult to directly measure the turbulent motion of
the gas via the Doppler shift of X-ray lines. Since the information on the
turbulent gas velocities would have profound implications for the mass
determination of clusters and for determining the plasma microphysics, new
approaches have been developed to indirectly measure the gas velocities using
existing X-ray data. One of these approaches is based on the analysis of
small-scale fluctuations in X-ray images as described below.
In relaxed clusters the gas approaches the state of hydrostatic equilibrium,
when all thermodynamic properties are aligned along surfaces with equal
gravitational potential, making X-ray images smooth and round (see Fig.1). These
stratified and stable atmospheres of cluster gas bear much similarity to the
Earth's atmosphere or to water in the oceans where cold and dense material tends
to be below hotter and lighter material due to the combined action of gravity
and buoyancy. Slow subsonic perturbations of such atmospheres can be represented
as a combination of internal (gravity) waves, very much like waves in the ocean
(bottom panel of Fig.1). In oceans there is a simple relation: the larger the
amplitude of the waves, the higher the velocity of water. Is the same true for
gas in galaxy clusters? Both theoretical analysis and numerical simulations have
shown that this is indeed the case.
The main idea is that gas is disturbed on large scales and that this results in
a cascade of waves. In clusters these waves are creating perturbations in the
gas density that are visible in X-ray images as small-scale fluctuations of the
surface brightness relative to a smooth global model. Our analysis shows that
there is a simple linear relation between the gas velocities and density
perturbations. Moreover, this relation holds for a broad range of scales: on
large scales, where buoyancy effects dominate (internal waves), as well as on
small scales where the isotropic turbulent cascade usually develops. At these
small scales, the entropy of the gas acts as a passive scalar advected by the
velocity field and makes the gas displacement visible in X-rays.
Based on these arguments one can expect that in relaxed clusters (i.e. clusters
which are only slightly disturbed) the power spectrum of the velocity field can
simply be recovered from the power spectrum of density fluctuations. The latter
can be straightforwardly estimated from X-ray images.
Numerical simulations (cosmological simulations of cluster formation and pure
hydrodynamic simulations with turbulence) confirm this conclusion and open an
interesting possibility to use gas density power spectra as a proxy for the
velocity power spectra in relaxed clusters.
Once the gas velocities can be measured directly with future X-ray
observatories, it will be possible to push this analysis further and search for
differences between the density and velocity power spectra. Strong departures
of the two power spectra from the universal behavior described above can then
be used to constrain physical effects such as conductivity or viscosity in the
gas.
Eugene Churazov (MPA), Massimo Gaspari (MPA), Irina Zhuravleva (Stanford), Alex
Schekochihin (Oxford), Rashid Sunyaev (MPA)
References:
Zhuravleva I., Churazov E., Schekochihin A. A., Lau E. T., Nagai D., Gaspari
M., Allen S. W., Nelson K., Parrish I. J., The Relation between Gas Density
and Velocity Power Spectra in Galaxy Clusters: Qualitative Treatment and
Cosmological Simulations,  2014, ApJL, 788,
13 2014, ApJL, 788,
13
Gaspari M., Churazov E., Nagai D., Lau E. T., Zhuravleva, I., The relation
between gas density and velocity power spectra in galaxy clusters:
high-resolution hydrodynamic simulations and the role of conduction, 2014, A&A, 569A, 67 2014, A&A, 569A, 67
Gaspari M., Churazov E., Constraining turbulence and conduction in the hot
ICM through density perturbations,  2013, A&A, 559A,
78 2013, A&A, 559A,
78
Churazov E.; Vikhlinin A.; Zhuravleva I.; Schekochihin A.; Parrish I.; Sunyaev
R.; Forman W.; Böhringer H.; Randall S., X-ray surface brightness and gas
density fluctuations in the Coma cluster, 2012, MNRAS,
421,1123 2012, MNRAS,
421,1123
|


