![]()
|
|
||
|
The Millennium Simulation Project | ||
|
|
|||
| Go to: -Movies of the simulation
|
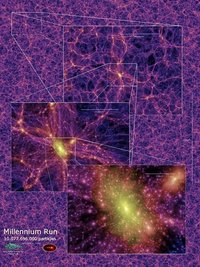
The Millennium Run used more than 10 billion particles to trace the evolution of the matter distribution in a cubic region of the Universe over 2 billion light-years on a side. It kept busy the principal supercomputer at the Max Planck Society's Supercomputing Centre in Garching, Germany for more than a month. By applying sophisticated modelling techniques to the 25 Tbytes of stored output, Virgo scientists have been able to recreate evolutionary histories both for the 20 million or so galaxies which populate this enormous volume and for the supermassive black holes which occasionally power quasars at their hearts. By comparing such simulated data to large observational surveys, one can clarify the physical processes underlying the buildup of real galaxies and black holes. A 3-dimensional visualization of the Millennium Simulation. The movie shows a journey through the simulated universe. On the way, we visit a rich cluster of galaxies and fly around it. During the two minutes of the movie, we travel a distance for which light would need more than 2.4 billion years.
Get this movie in different versions:
The movies below shows the dark matter distribution in the universe at the present time, based on the Millennium Simulation, the largest N-body simulation carried out thus far (more than 1010 particles). By zooming in on a massive cluster of galaxies, the movie highlights the morphology of the structure on different scales, and the large dynamic range of the simulation (105 per dimension in 3D). The zoom extends from scales of several Gpc down to resolved substructures as small as ~10 kpc.
Get this movie in different resolutions:
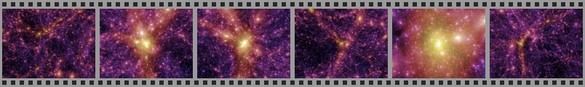
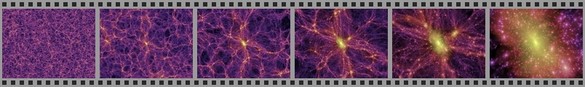
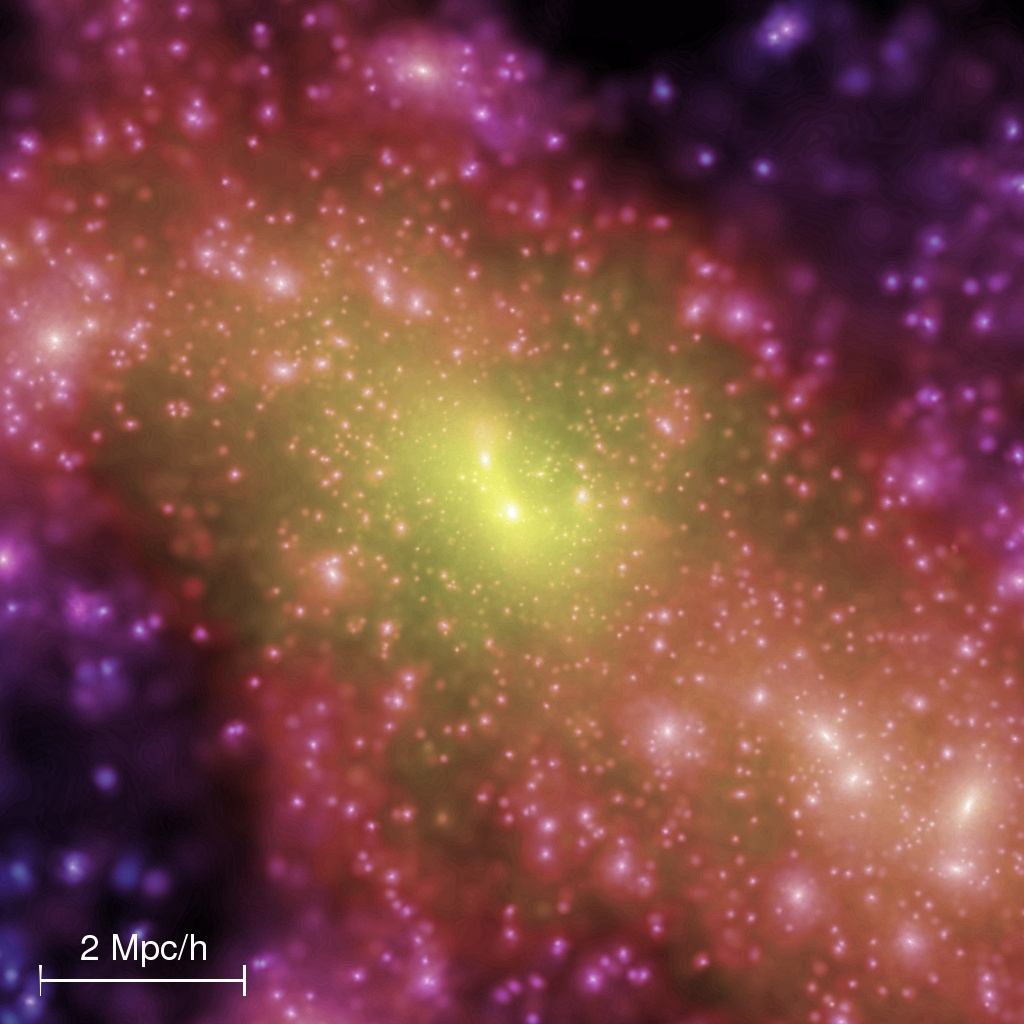
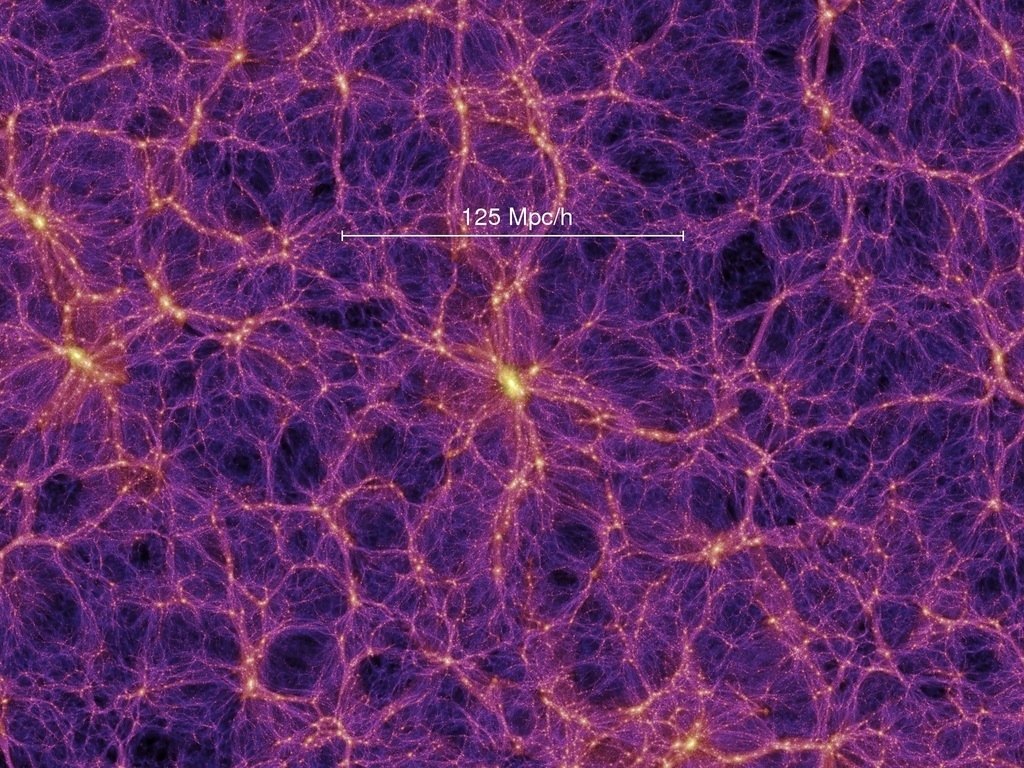
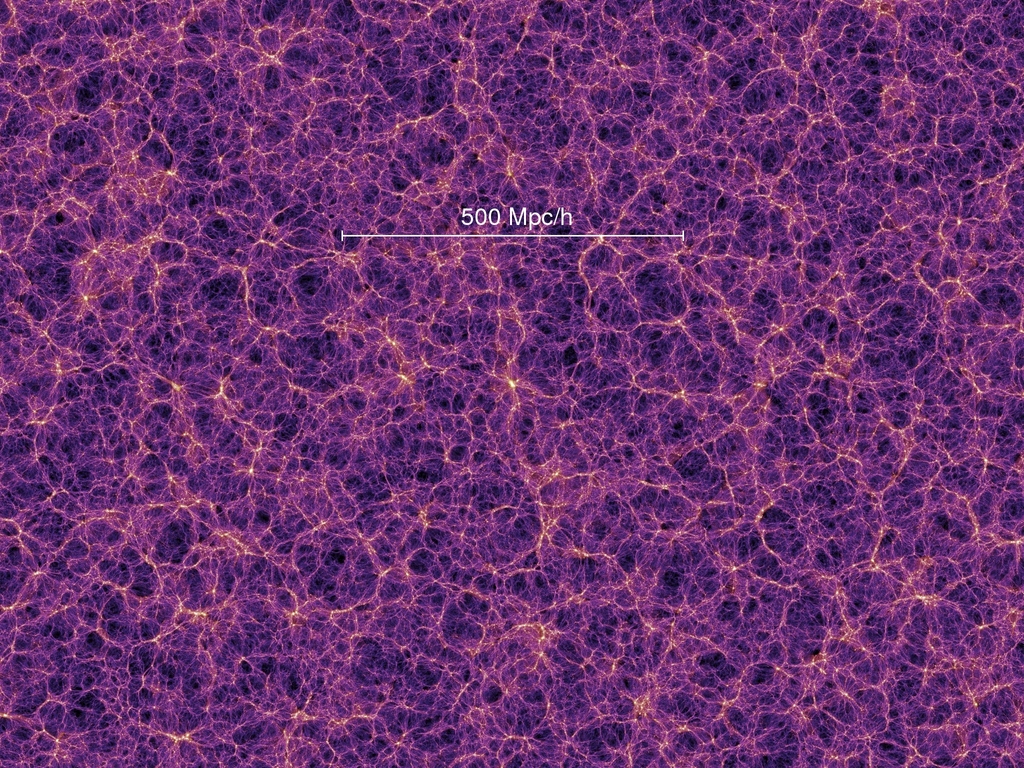
Pictures of the galaxy distribution The top row
of the following pictures shows the galaxy distribution in the
simulation, both on very large scales, and for a rich cluster of
galaxies where one can see them individually. The top right
panel hence represents the large-scale light distribution in the
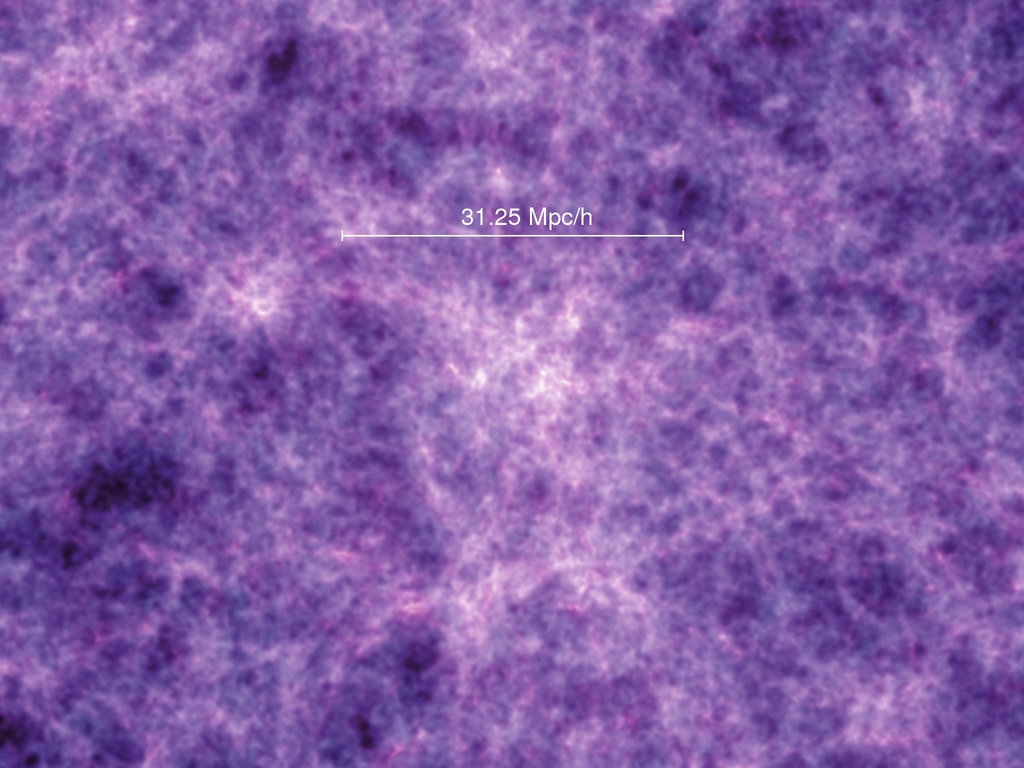
Universe. For comparison, the images in the lower row give the
corresponding dark matter distributions.
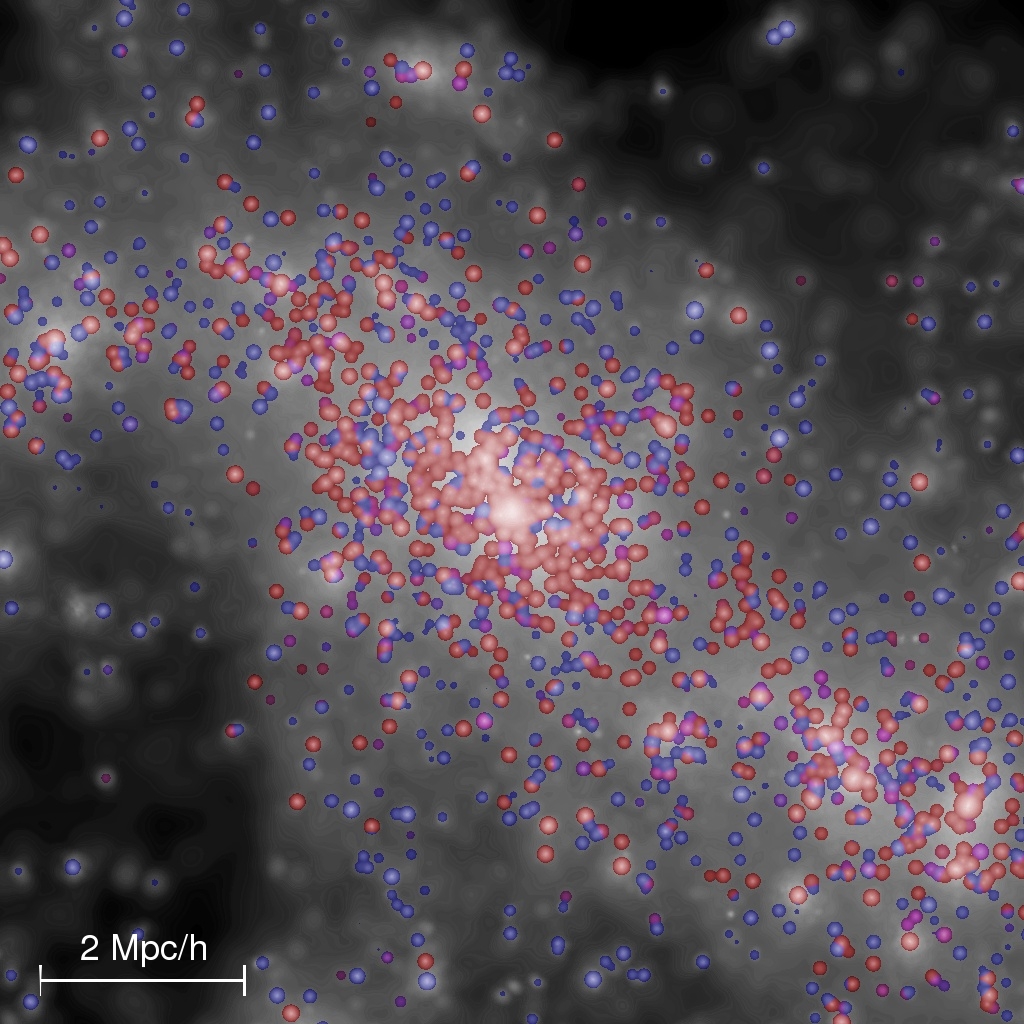
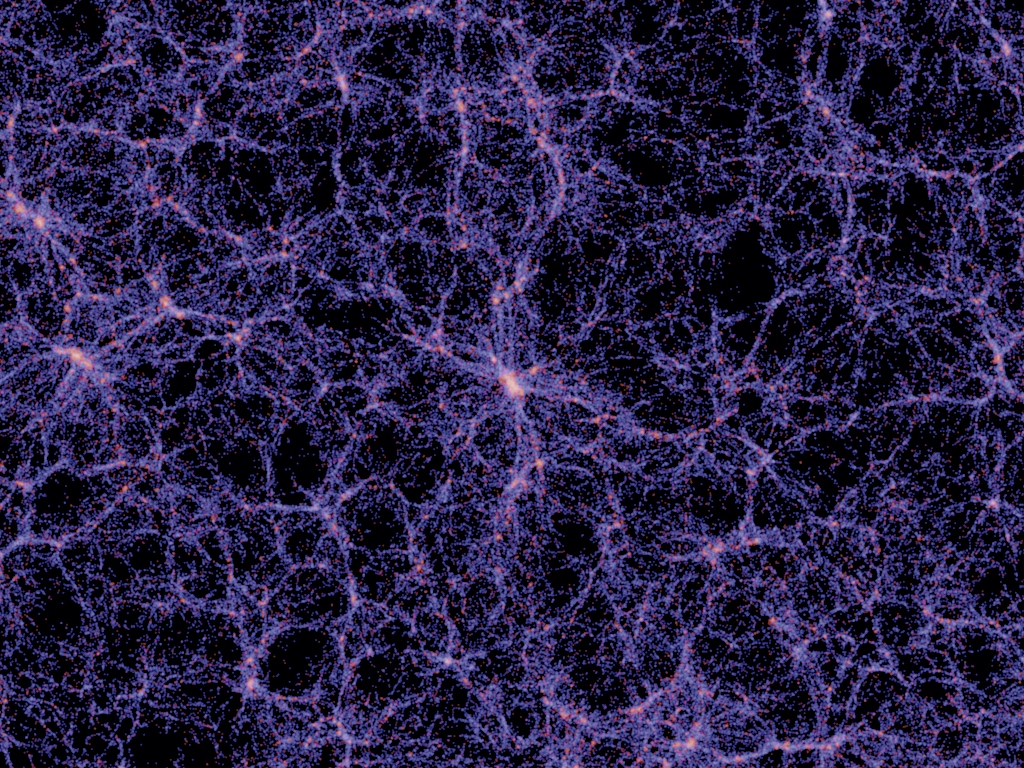
Slices of the dark matter distribution
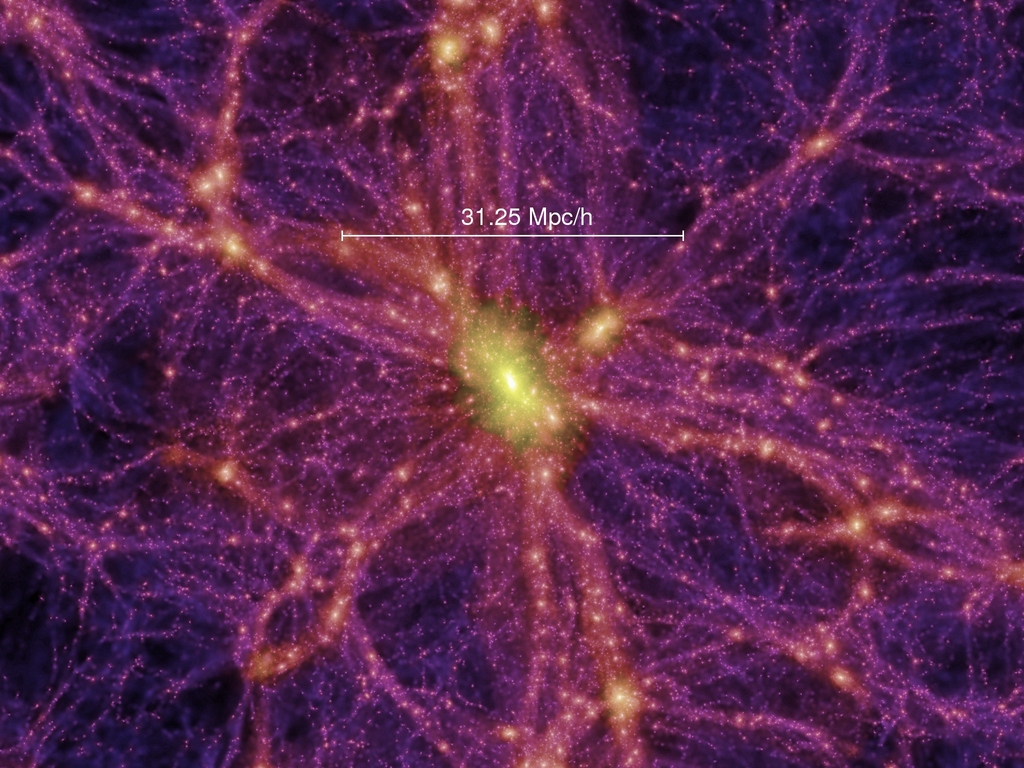
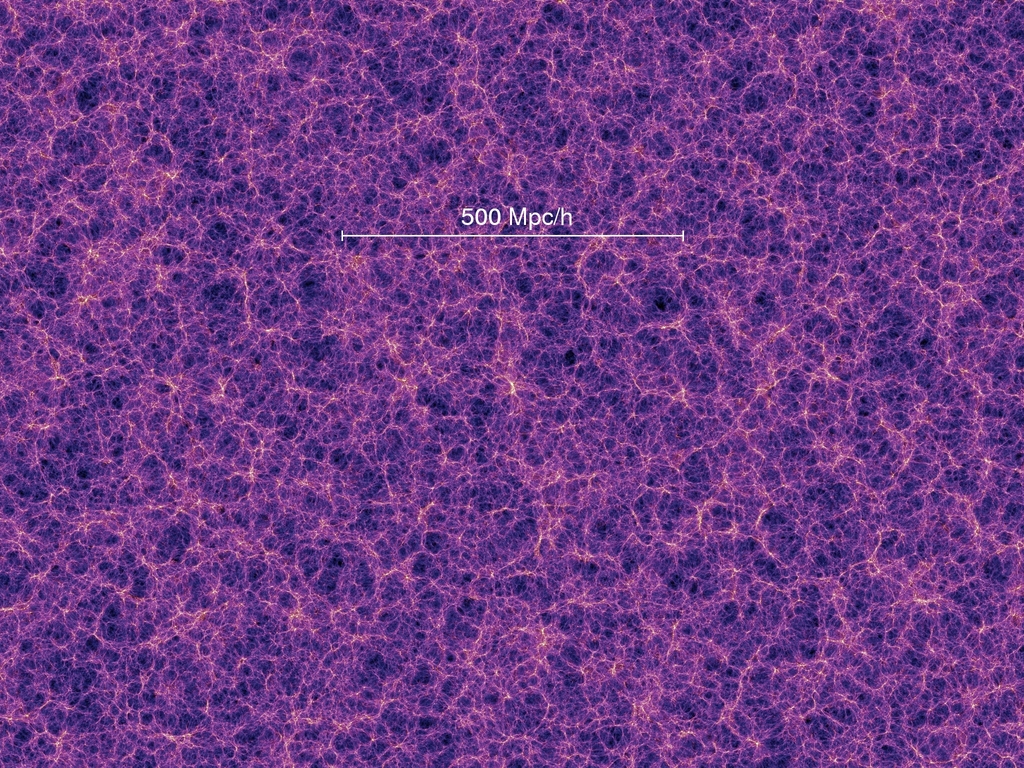
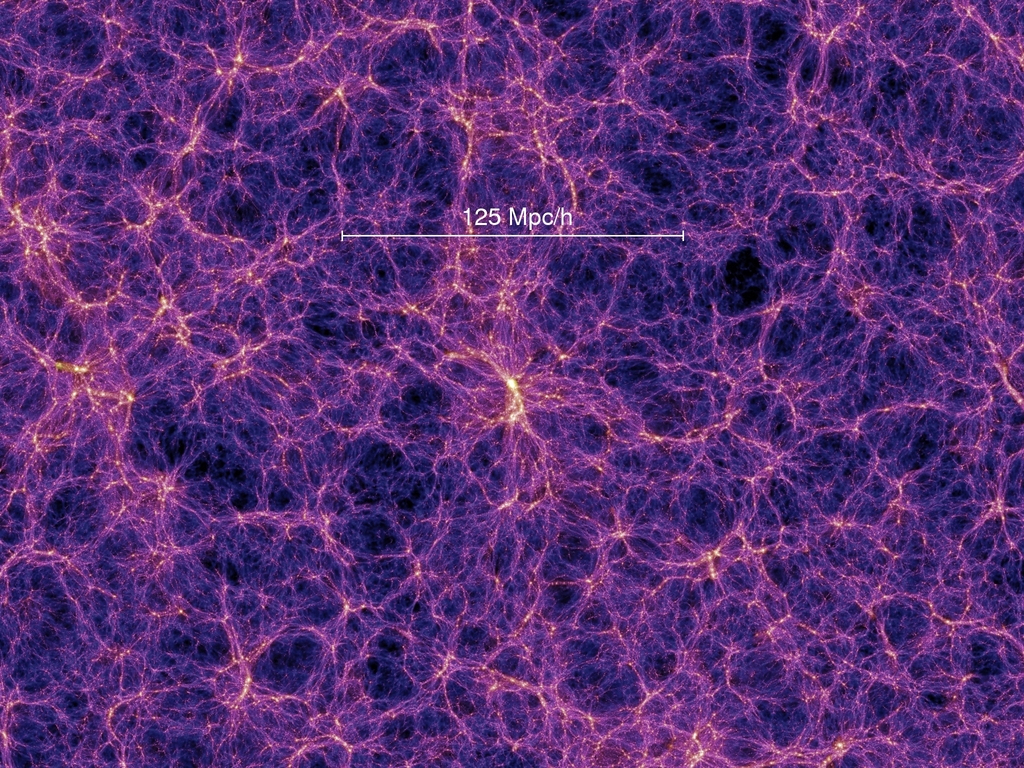
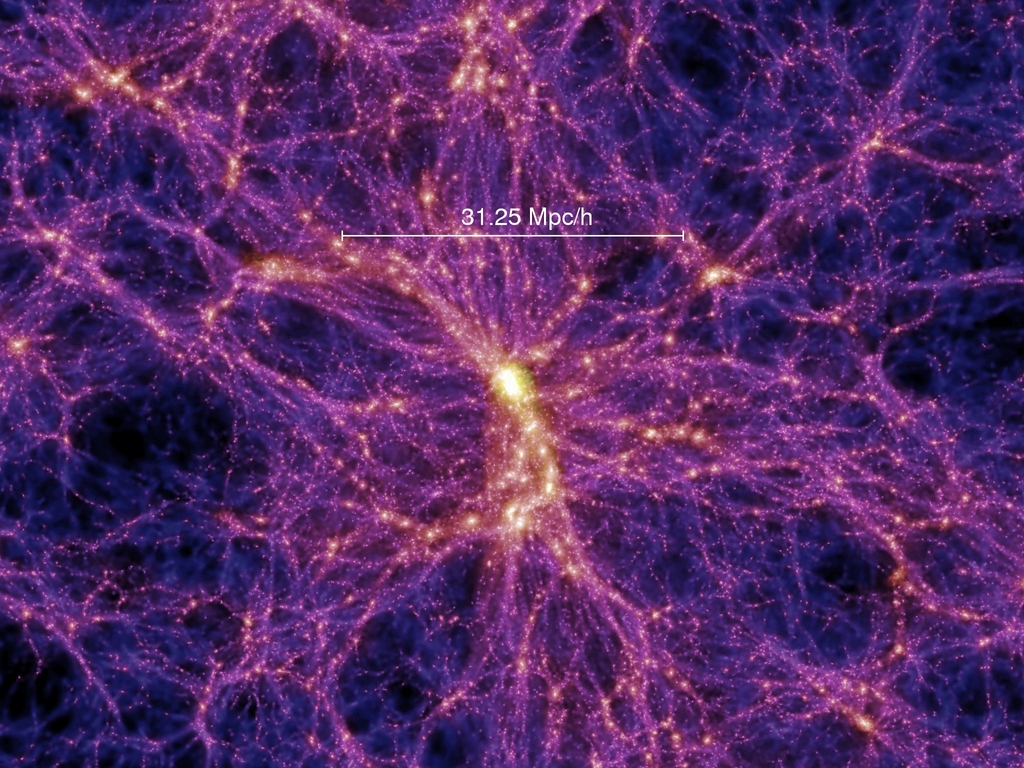
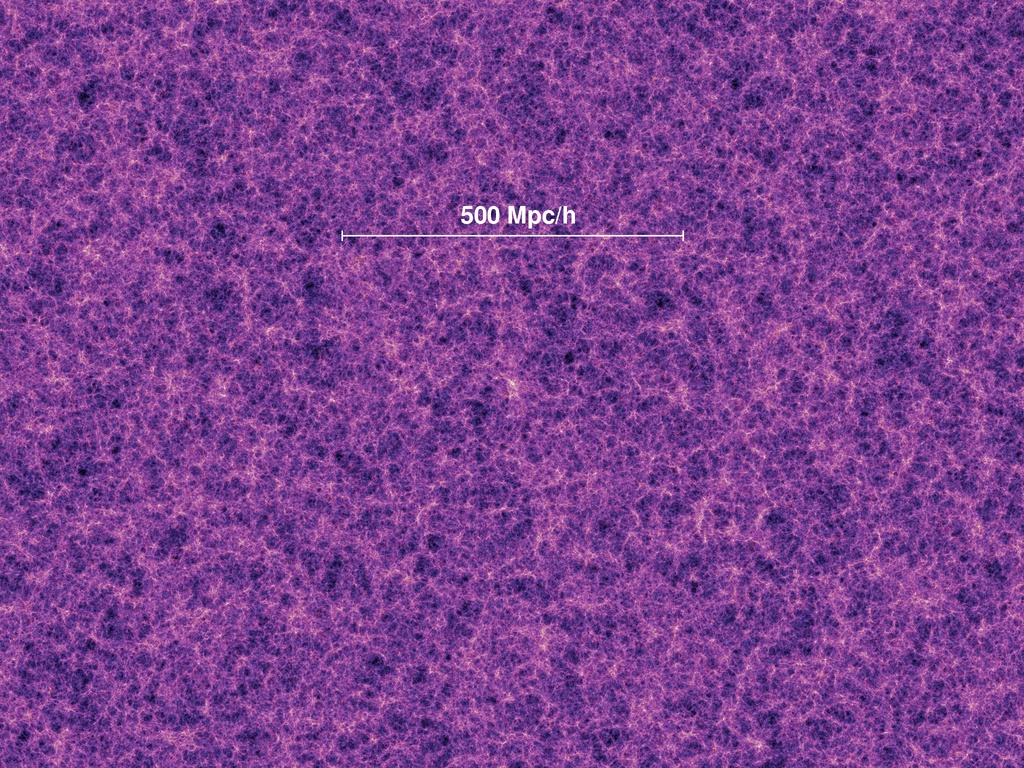
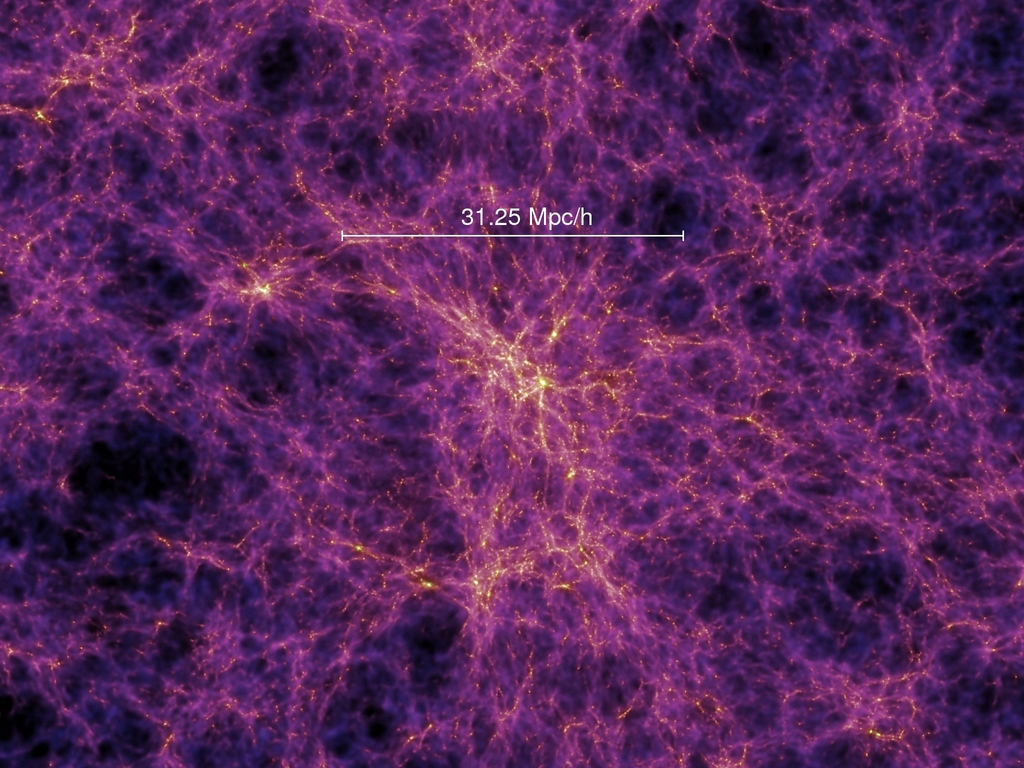
The following poster shows a projected density field for a 15 Mpc/h thick slice of the redshift z=0 output. The overlaid panels zoom in by factors of 4 in each case, enlarging the regions indicated by the white squares. Yardsticks are included as well. The postscript file has been produced for A0 format. Beware of it's huge size.
The following slices through the density field are all 15 Mpc/h thick. For each redshift, we show three panels. Subsequent panels zoom in by a factor of four with respect to the previous ones.
Halo and semi-analytic galaxy catalogues
Comments to: Virgo Administrator |
|||||||||||||||||||||||||||||||||||||||