|
|
|
|
|
|
|
|
|
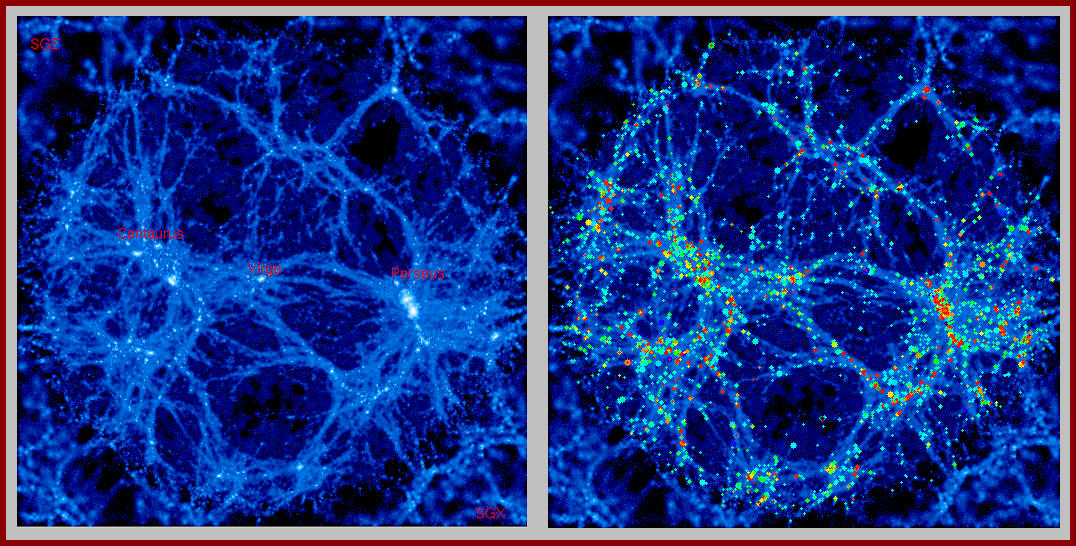
| Further slices excised from the simulations (other colour scale) |
All slices are 30 Mpc/h thick, with normal direction supergalactic SGZ, SGY, SGX respectively. One side of a slice reaches 180 Mpc/h. The inner sphere of radius 90Mpc/h is resolved with higher resolution (factor 40 in mass) than the surrounding zone.
One can distinguish the nearby massive structures such as the Virgo cluster, the Pavo-Indus, Hydra-Centaurus, and Pisces-Perseus complexes. Further out lies the Coma cluster, just within the high-resolution zone.
Left slices show the dark matter distribution only, while right ones show the dark matter distribution with the galaxies obtained from the semi-analytic (SA) code plotted on top of it.
As the SA code follows the history of the high-resolution particles, galaxies mainly remain within the inner sphere. The galaxies' symbols scale in radius with their B band magnitude, in colour with the B-V index.
In these pictures, the luminosity cutoff in the
B band is given by the morphological resolution of the simulations:
-18.46 in LCDM, -20.61 in TCDM.
Click on the picture to get the full size image.
|
|
|
|
|
|
|
|
|
Back to the Constrained Realizations Main Page
![]() Back to the Galaxy Formation Group at MPA
Back to the Galaxy Formation Group at MPA
Last modified: Nov 6, 2001. For Questions / Comments / Remarks : hmathis@mpa-garching.mpg.de


 Back to NumCos